
Figure 6.
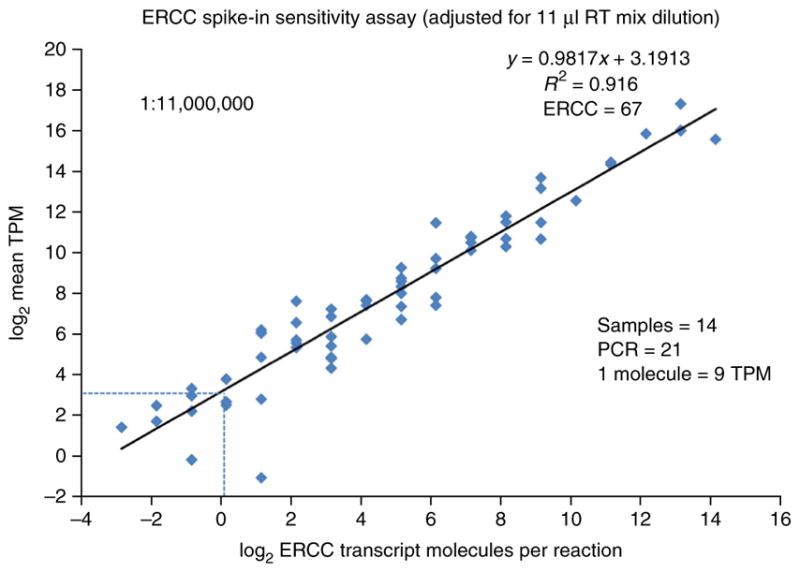
Behavior of ERCC spike-in controls, sensitivity and detection limit estimation. The number of ERCC spike-in transcript molecules, diluted 1.1 × 10⁷ fold from the original stock in the final RT-mix, are plotted against the average TPM expression values across all 14 samples using log2 scale for both axes. The 1.1 × 10⁷-fold dilution (PROCEDURE Step 13 and INTRODUCTION) is greater than that recommended by the ERCC spike-in manufacturer, who had optimized it for use with nanogram quantities of RNA in microarray studies. The low levels of RNA in a single nucleus necessitate the greater dilution in order to avoid high percentages of sequencing reads devoted to ERCC spike-ins. However, some of the lower-copy transcript species present in the ERCC spike-in stock are consequently diluted to <1 copy per Smart-seq2 reaction tube. ERCC spike-in transcripts with expression in at least one of the 14 nuclei were considered (ERCC n = 67 of 92) with regression equation y = 0.9817x + 3.1913 and R2 = 0.916. The RNA released from the lysed nuclei plus the added ERCC spike-in controls were amplified to 21 PCR cycles. The detection threshold for a single ERCC spike-in transcript molecule is shown to be approximately equivalent to 9 TPM RNA expression units (1 molecule = 9 TPM, as indicated by the intersection of the dashed lines).