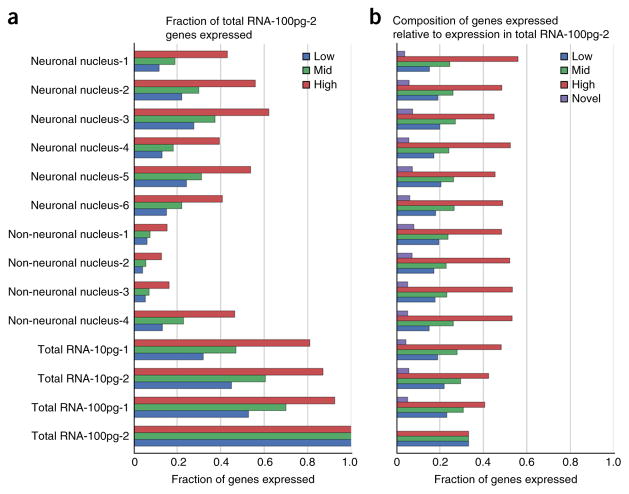
Figure 7.
Biological variation and technical noise stratified by relative expression of genes. The genes that are expressed in bulk Total RNA-100pg-2 (see Supplementary Table 1) were stratified equally into low, mid and high expressers based on their TPM values (4,292 genes per category). Low genes had TPM values between 0.01 and 7.44, mid genes had TPM values between 7.45 and 25.97 and high genes had TPM values >25.98 (a). For the 4,292 genes of each category, the graph shows the fraction found in each sample. By definition, Total RNA-100pg-2 has 100%, 100% and 100% representation for low, mid and high (b). Each gene that is expressed in the sample is labeled by its expression in the bulk RNA sample. The fraction of low-, mid- and high-expressed genes, as well as novel genes that were not found in the bulk control, was quantified.

