
Figure 2.
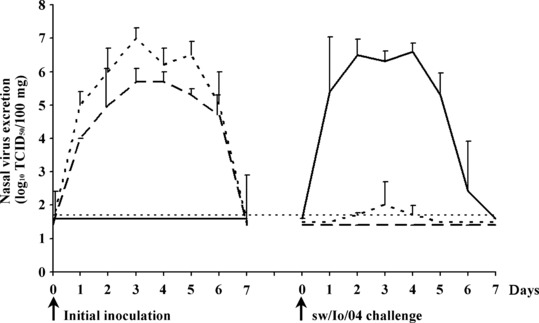
Nasal virus excretion after initial inoculation and after challenge with sw/IA/04. Mean virus titers in nasal swabs of each group are given. Sw/B/98‐sw/IA/04, sw/IA/04‐sw/IA/04 and sw/IA/04‐control groups are represented by dotted, dashed and full lines, respectively. The thin dashed line represents the detection limit (<1·7 log10 TCID50/100 mg).