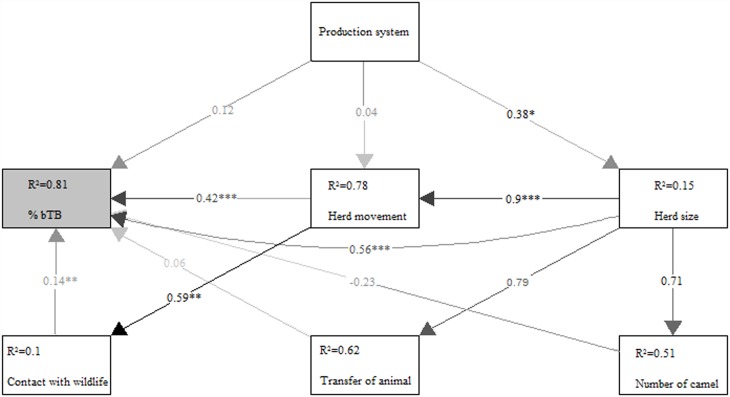
Fig 2. Structural equation modelling graph of the direct and indirect effects of risk factors on bTB prevalence (% bTB).
The arrows indicate supported path coefficients. * p< 0.05; ** p< 0.01; *** p< 0.001. Variables are herd size (size), the average herd movement in a day (movement), number of animal transferred (transfer), number of camels (camel), production system (production), and contact with wildlife (wildlife). The proportion of variance explained (R2) appears above every response variable in the model.

