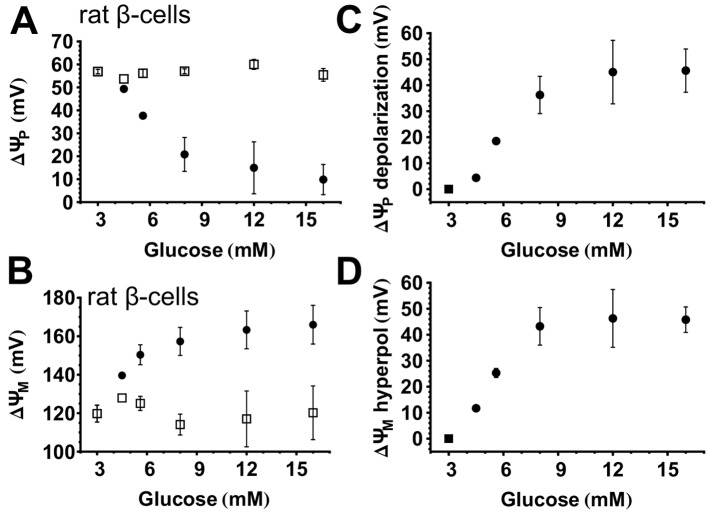
Fig 4. Concentration-dependent hyperpolarization of ΔψM and ΔψP by glucose in rat primary β-cells.
(A-B) Absolute magnitudes of ΔψP and ΔψM. For each [glucose], first the baseline (open squares) was recorded in the presence of 3 mM glucose in a rich medium then [glucose] was elevated to the indicated value (closed circles). (C-D) Depolarization of ΔψP and hyperpolarization of ΔψM relative to baseline. The square marks the zero value, while closed circles mark the relative change from the baseline. Data are mean±SE of n = 3 experiments conducted similarly to the one shown in Fig 2. The response to glucose was determined as the mean of potentials measured at 30–60 min after addition of glucose.

