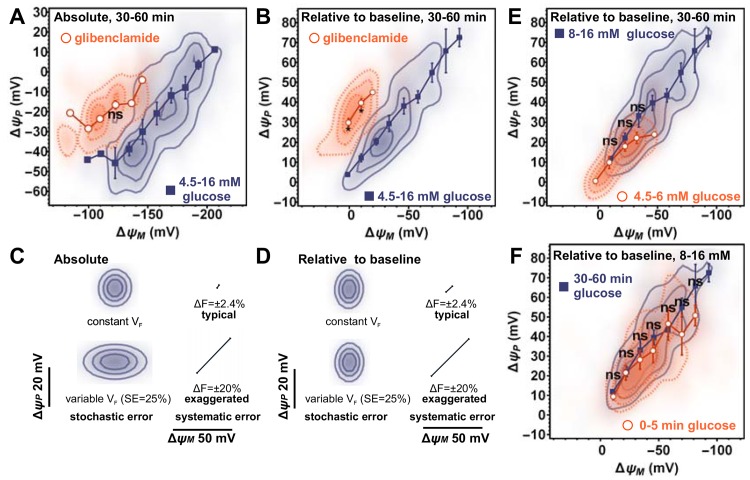
Fig 6. Heterogeneous response of individual rat β-cells to glucose.
(A) ΔψP as a function of ΔψM in the presence of 4.5–16 mM glucose (solid isolines and closed squares) or 50 μM glibenclamide (dotted isolines and open circles). Two-dimensional histograms show the distribution of absolute potentials measured 30–60 min after secretagogue addition. Histograms were compiled from 364 and 55 cells for glucose and glibenclamide, respectively, pooled from 3 experiments (spanning the range of 4.5–16 mM [glucose] in each experiment using different wells, corresponding to data in Fig 4). Symbols indicate mean±SE of potentials calculated by binning cells along the ΔψM axis (n = 3 experiments). (B) ΔψP depolarization relative to baseline as a function of ΔψM hyperpolarization relative to baseline evoked by glucose or glibenclamide calculated from data in (A). (C-D) Predicted uncertainty of single-cell potential calibration when the absolute magnitude of stimulation-evoked potentials (C; corresponding to A) or the relative changes to baseline (D; corresponding to B,E,F) are calculated. The distributions marked by isolines visualize stochastic uncertainty originating from detection error assuming constant (top distribution) or cell-to-cell variable VF (bottom distribution). Straight lines indicate the direction and magnitude of the predicted SE of a stimulation-evoked transient change in the efficiency of collecting single-cell fluorescence of the indicated magnitude. Notably the standard error of the stimulation-evoked total fluorescence change measured using the pH-insensitive fluorescence of superecliptic synaptopHluorin corresponds to the top line. (E) Relationship between relative potential changes evoked by low glucose (4.5–6 mM; dotted isolines and open circles; 79 cells) and high glucose stimulation (8–16 mM; solid isolines and closed squares; 285 cells). (F) Relationship between relative potential changes evoked by high glucose (8–16 mM; 285 cells) in the first phase of stimulation (0–5 min; dotted isolines and open circles) and in the plateau phase of the stimulation (30–60 min solid isolines and closed squares). (A-B,E-F) For each bin, values of ΔψP in the two groups were compared by t-test performed on the experimental repeats (*p<0.05; ns, not significant. p is not indicated for bins where data were insufficient).

