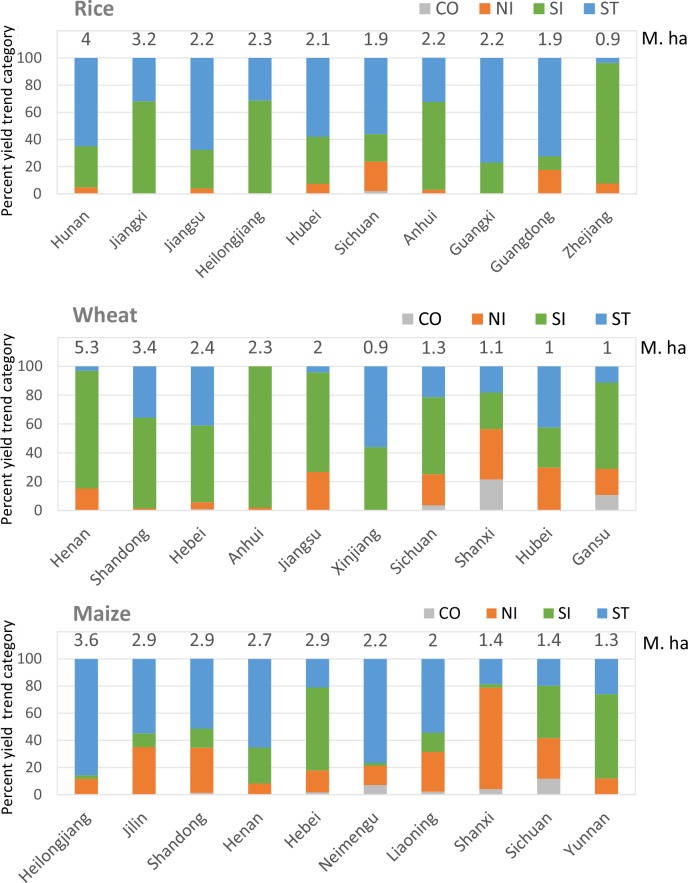
Fig 4. Crop yield trend status for top 10 producers in China.
The top 10 producers were derived from average crop production of 2006–2010 report by NSB, arranged in the horizontal coordinate by order of production size. Overall area was based on the harvest area from the five focus farming systems. Harvest area based on average 2006–2010.

