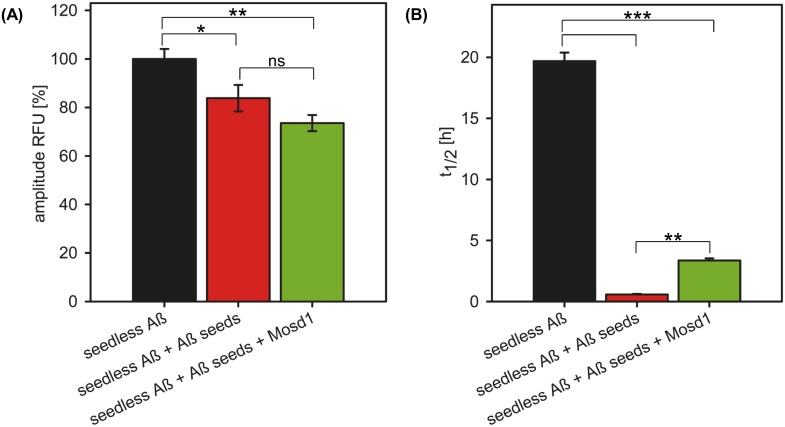
Fig 7. Reduction of seeded Aβ1–42 growth and fibrillar Aβ1–42 content.
Seedless Aβ1–42 was incubated alone (black) or together with fibrillary Aβ1–42 seeds previously incubated with (green) or without (red) a fivefold molar excess of Mosd1. ThT (20 μM) was added to each sample in order to measure fibrillar content. The data were fitted with an asymmetric five parameter fit. The (A) amplitude of relative fluorescence (RFU) of fibrillated seedless Aβ1–42 served as 100% to which the other values were normalized. The (B) half-life (t1/2), displaying the point in time, when half of the maximum ThT signal (i.e. fibrillary content) was reached. Statistical significance was determined by one-way ANOVA. Error bars display SEM. ns: p > 0.05; *: p ≤ 0.05; **: p ≤ 0.01; ***: p ≤ 0.001.

