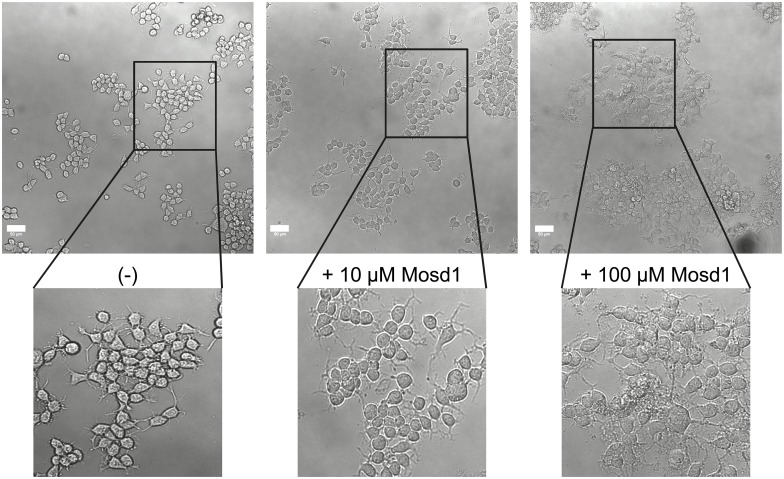
Fig 9. Effect of Mosd1 on Neuro-2a cells.
Overview and detailed pictures of wild type Neuro-2a cells are shown. Neuro-2a cells were treated with 0, 10 and 100 μM of Mosd1, respectively. The left panel shows untreated wild type Neuro-2a cells. In the middle and right panel, incubation of wild type Neuro-2a cells with 10 μM Mosd1 and 100 μM Mosd1 are shown. Cell viability and morphology were analyzed with a LSM 710 laser scanning microscope. Scale bars equate 50 μm.

