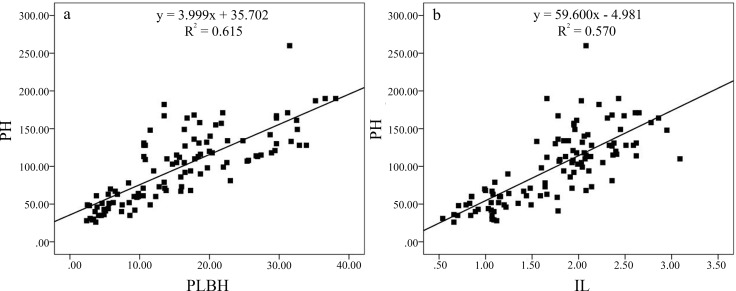
Fig 4. Scatter plots of the phenotypes in the F1 population derived from Lagerstroemia fauriei (non-dwarf) × L. indica ‘Pocomoke’ (dwarf).
The traits were evaluated for each individual with three replicates. All of the data analyses were conducted using the SPSS Statistics 20.0 program (SPSS, Chicago, IL, USA); P < 0.01. (a) PH and IL, and (b) PH and PLBH.

