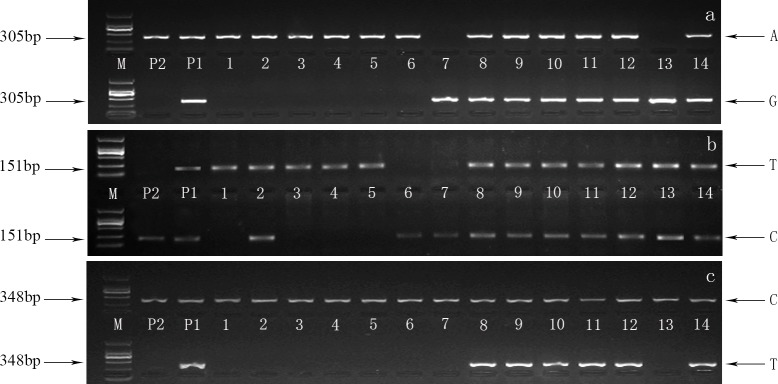
Fig 5. Agarose gel photo of the allele specific (AS) amplifications of the three markers.
a, b and c PCR products of M16337, M25207 and M38412, respectively. M represents a 2000 bp marker followed by the parent lines and lanes 1–14 with template DNA derived from: P1 female parent, P2 male parent, 1–7 dwarf type individuals, 8–14 non-dwarf type individuals. The same samples were employed in the same order between the upper and lower band of the AS-PCRs. For the three markers, the upper band and lower band were amplified independently of the targeted SNP genotype. The corresponding tested SNP alleles are indicated in the figure.

