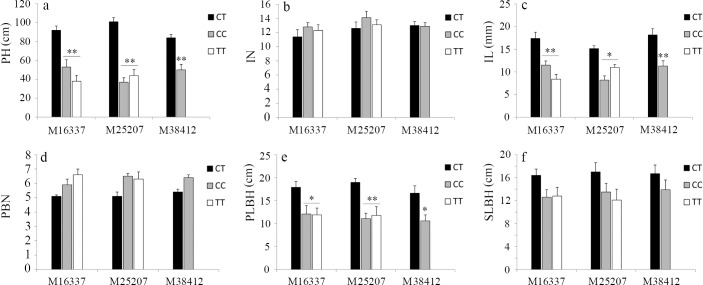
Fig 6. Analysis of the phenotype variance corresponding to the three markers in the F1 population (one-way ANOVA).
All of the abbreviations are the same as above. The X-axis represents the three SLAF markers, and the Y-axis represents the phenotypic traits in the F1 population. (a) Correlation analysis between PH and the three markers, (b) correlation analysis between the IN and the three markers, (c) correlation analysis between the IL and the three markers, (d) correlation analysis between the PBN and the three markers, (e) correlation analysis between the PLBH and the three markers, (f) correlation analysis between the SLBH and the three markers. Pillar colors represent the different genotypes of each marker as follows: black pillar, CT; grey pillar, CC; and white pillar, TT. Asterisks indicate P < 0.05 (*) and P < 0.01 (**) according to Student’s t-test.

