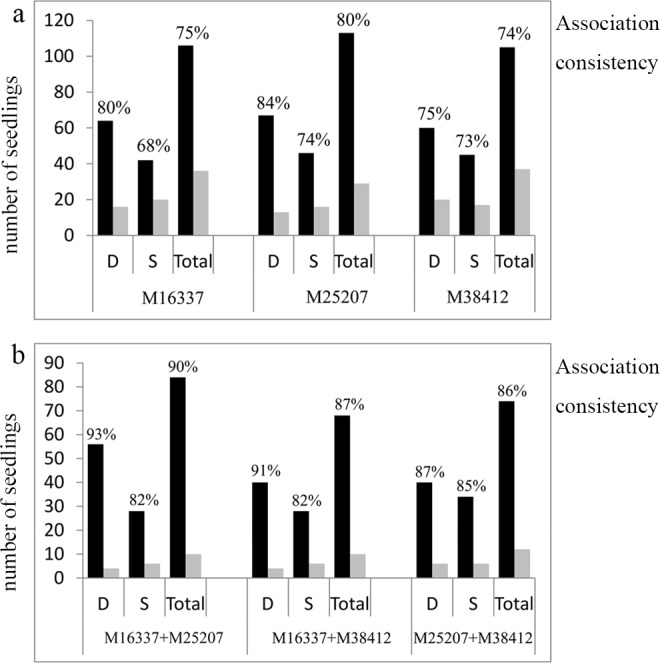
Fig 7. Association consistency between the plant architecture phenotypes and the SNP markers in the F1 population.

The figures immediately above each column are the accuracy rates observed in that genotype-phenotype category. Association consistency is the proportion of seedlings for each plant type phenotype with the expected genotype. The black pillar represents the correct proportion, and the grey pillar represents the wrong proportion in the genotype-phenotype association. (a) Association consistency using a single marker, and (b) association consistency using marker combinations.
