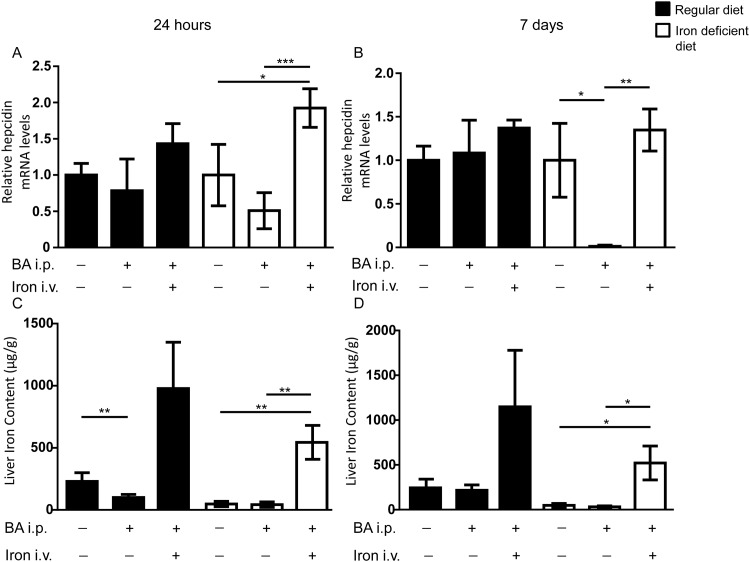
Fig 5. Hepcidin response to iron treatment depends on the diets.
WT mice were challenged with or without intraperitoneal BA injection and 14d later treated with or without intravenous iron. (A) Hepatic hepcidin mRNA levels 24h after iron treatment in mice fed a regular iron diet (black bars) or an iron deficient diet (white bars) (iron deficient diet: n = 4, 2-way ANOVA P = 0.006; *P = 0.01: PBS/PBS vs BA/iron; ***P = 0.0002: BA/PBS vs BA/iron). (B) Hepcidin mRNA levels 7d after the iron treatment in mice as in (A) (iron deficient diet: n = 4, 2-way ANOVA P = 0.0007; *p = 0.02: PBS/PBS vs BA/PBS; **P = 0.001: BA/PBS vs BA/iron). (C) Liver iron content (LIC) was determined in C57BL/6 mice fed a regular or iron deficient diet. LIC 14d after BA and 24h after intravenous iron administration are shown (regular diet: n = 3–4, 2-way ANOVA P = 0.002; **P = 0.008: PBS/PBS vs BA/PBS, iron deficient diet: n = 4, 2-way ANOVA, P < 0.0001; **P = 0.005: PBS/PBS vs BA/iron; **P = 0.004: BA/PBS vs BA/iron). (D) LIC 14d after BA and 7d after iron treatment in mice fed a regular or an iron deficient diet (iron deficient diet: n = 4, 2-way ANOVA P = 0.0002; *P = 0.01: PBS/PBS vs BA/iron; *P = 0.01: BA/PBS vs BA/iron).

