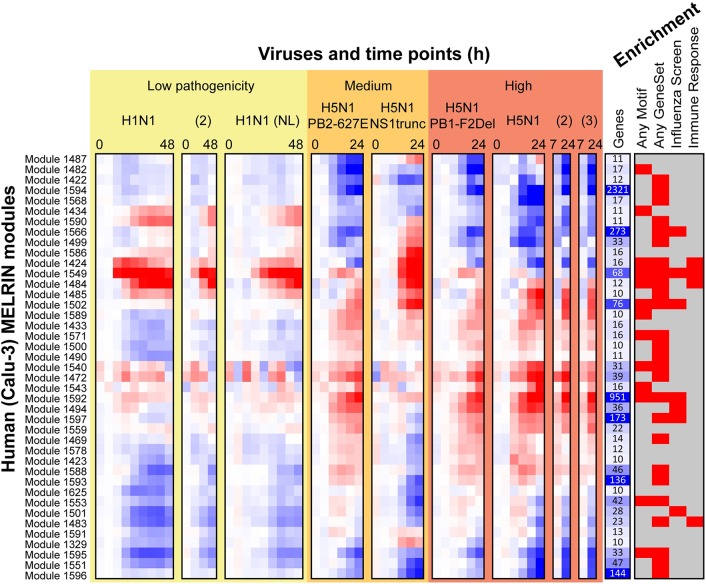
Fig 2. Overview of human influenza response module expression patterns.
Shown are 41 human Calu-3 modules with at least 10 genes. The red-blue heat map shows mean expression of all genes in each module. The more red an entry the higher the expression in infected versus mock, while the more blue the entry, the higher the expression in mock compared to the infected sample. Under “Viruses and time points (h)”, each virus treatment's time series is shown separately, and viruses are ordered from low to high pathogenicity. Low-pathogenicity samples labeled H1N1 used A/CA/04/09 H1N1 unless labeled '(NL)' for A/Netherlands/602/09. Samples labeled H5N1 used A/VN/1203/04 H5N1 and laboratory mutants thereof. The “Genes” column shows the size of each module; larger values are shown in darker blue. Under “Enrichment”, a red box indicates module enrichment with any MSigDB motif, any MSigDB gene set, any Gene ontology process, any influenza screen set, or any immune response gene set (Methods).

