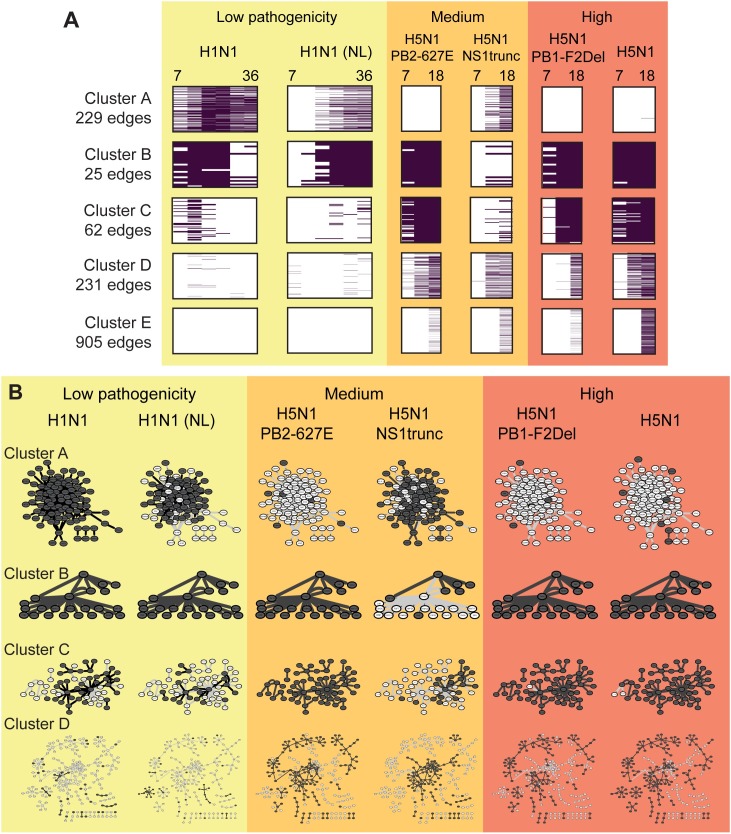
Fig 6. Time-point and virus-specific active subnetwork clusters.
A. Clusters identified using hierarchical clustering of edges based on the presence/absence pattern of edges across time and virus strain. Each row represents an edge. All clusters are uniformly scaled to the same height, but comprise varying numbers of edges (shown on left). B. Active subnetworks defined by clusters in A for each virus. The subnetwork for each virus is defined by taking the union of all edges present at any time point for that virus. Dark nodes/edges are active in both the cluster and any time-point for the virus; light nodes/edges are active in all other viruses and part of this cluster.

