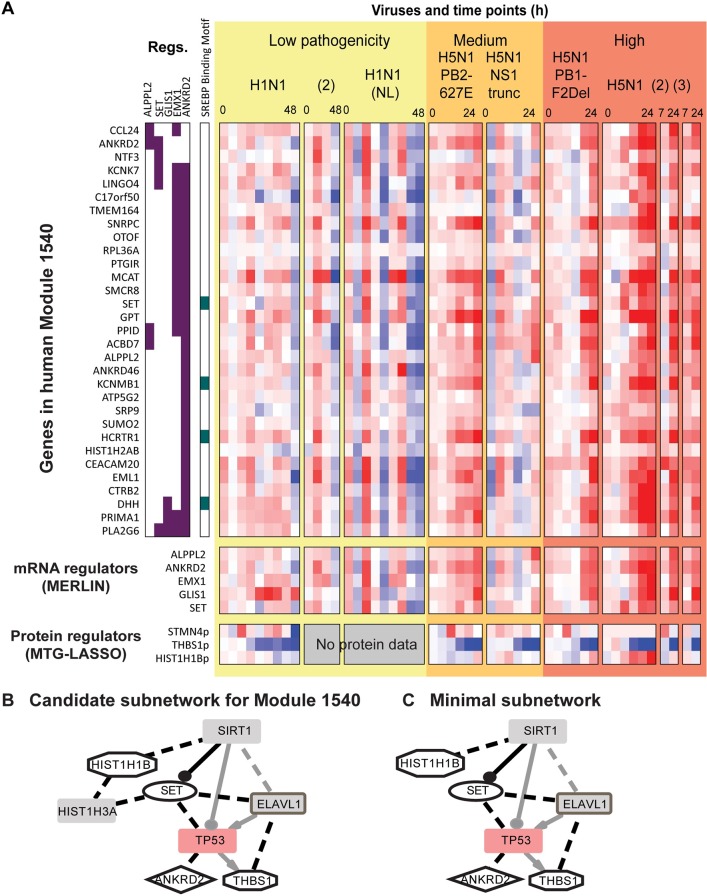
Fig 9. Target and regulator expression profile and the physical regulatory program of Module 1540.
A. Heatmap visualization of module 1540 genes and regulators. In the “Regs” columns, consensus MERLIN regulators for each gene are marked with purple boxes. Next, genes with SREBP binding motif are marked in green. Below the heatmap for module genes are rows for MERLIN-predicted mRNA regulators and MTGLASSO-predicted protein regulators. Gene expression values are scaled (-2,2); protein values are scaled (-1,1) to improve visibility. B. Original subnetwork for Cluster 1540. Black edges link regulators to intermediates; these are provided as input to the ILP method. Additional interactions from the background network between regulators and intermediates are shown in grey. See Fig 7B for additional legend details. C. Minimal subnetwork for Cluster 1540, output from the ILP-based subnetwork inference method. Compared to the original subnetwork, the minimal subnetwork prunes away one protein: HIST1H3A. See Fig 7B for legend.

