
Figure 3. Polymerase II mechanistic kinetic model used to simulate the data.
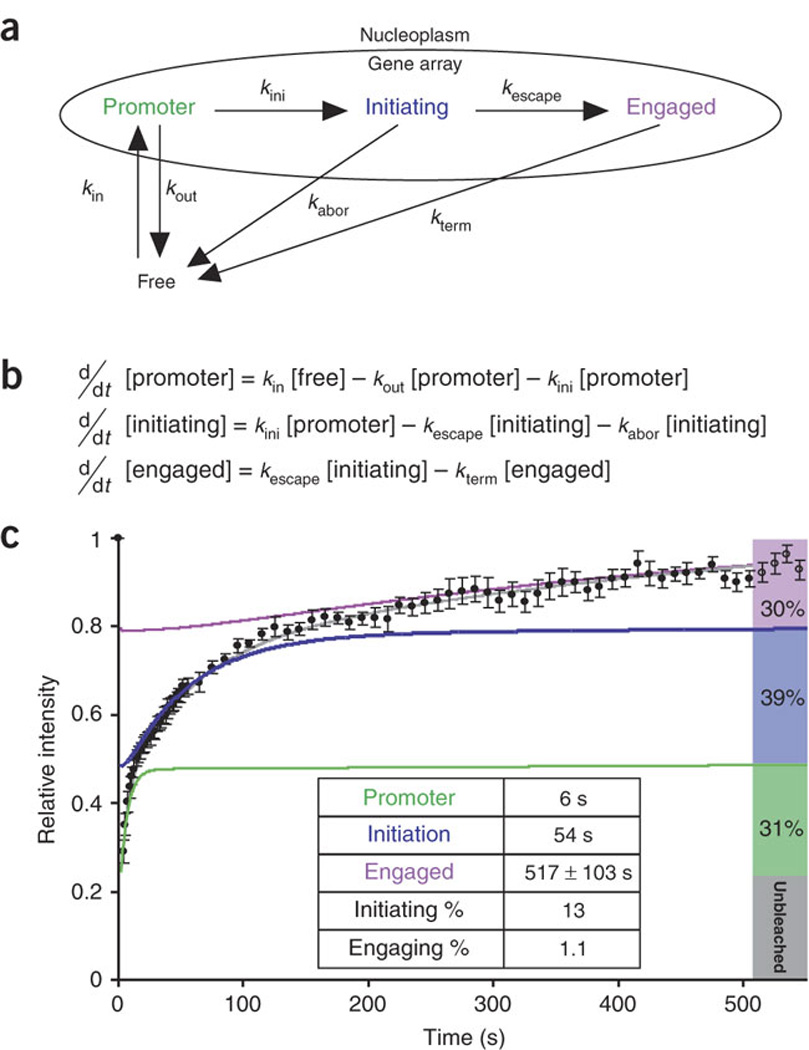
(a) Arrows labeled with rate constants represent transitions. (b) Differential equations simulating the mechanistic model in a, used to analyze the data in c. (c) Normalized fluorescence recovery of YFP–Pol II after photobleaching (black dots; data are the same as in Fig. 2j). The best-fit solution for the mathematical model (gray) characterizes three kinetically distinct states of Pol II (green, blue and purple, respectively) and predicts the steady-state fraction accumulating in each state (right bars). Inset table lists residence times for each state and probabilities for each step derived from the model in a and equations in b.