
Figure 7. Modeling the kinetics of elongation during mRNA synthesis.
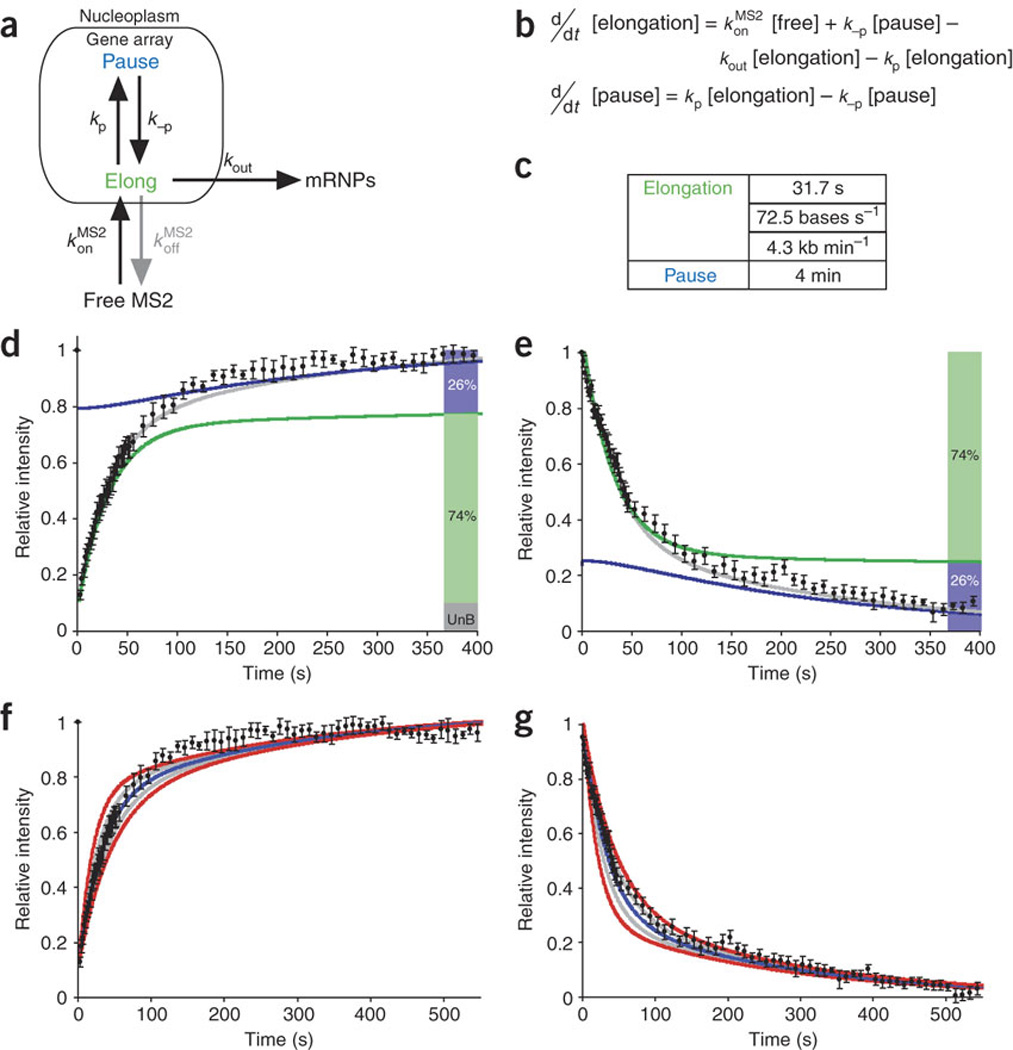
(a) Model of mRNA synthesis with two states, elongation and pausing, corresponding to kinetic parameters derived independently from Figure 6j,t. Arrows labeled with rate constants represent transitions. mRNPs, messenger ribonucleoprotein particles. (b) Differential equations corresponding to the model. (c) Residence times for each state. (d,e) Fits of the data from Figure 6 to this mathematical model. Shaded bars at right indicate fraction of mRNA in each state (UnB, unbleached fraction). Gray curve is best fit. (f,g) Assessment of errors for best-fit curves in d,e, as in Figure 5b.