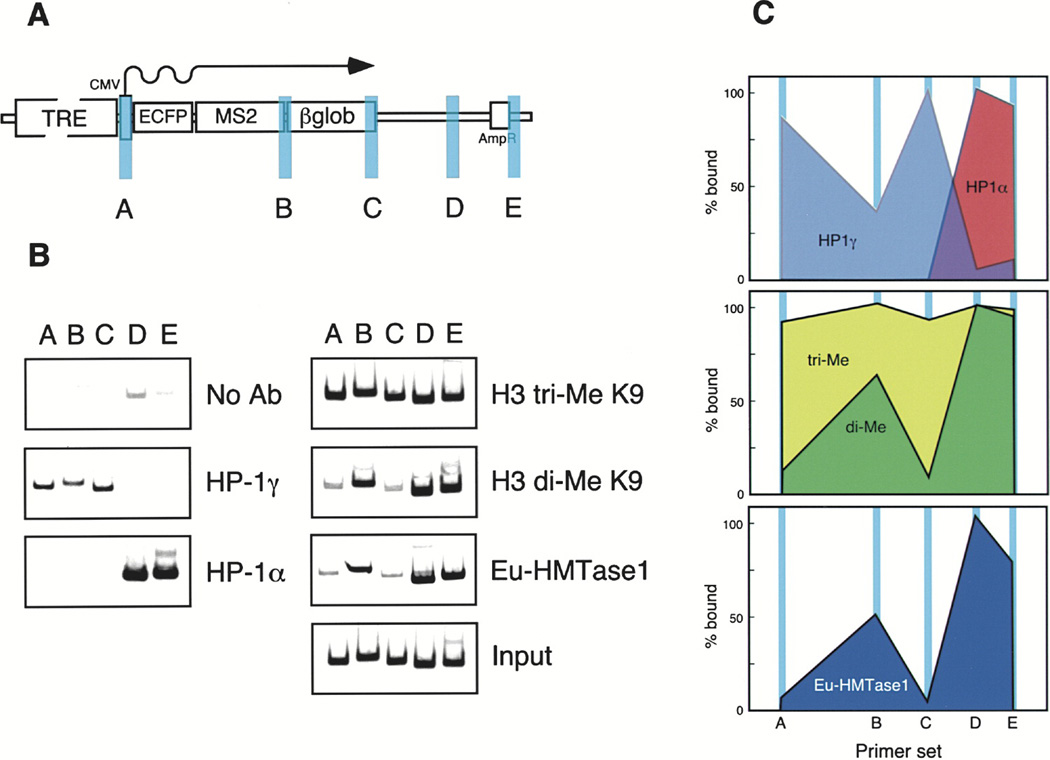
Figure 5. Chromatin Immunoprecipitation (ChIP) Analysis of Heterochromatin Proteins and Modifications on the Inactive Gene Expression Plasmid.
Diagram (A) depicts the gene expression plasmid and the location of the primer pairs used: (a) promoter, (b) beginning of β-globin intron/exon module, (c) end of β-globin intron/exon module, (d) and (e) bacterial plasmid sequence.
(B) Results of the ChIP analysis showing the localization of HP1α, HP1γ, histone H3 di- and tri-MeK9, and Eu-HMTase1 on the gene expression plasmid.
(C) The levels of the associated factors and modifications are plotted.

