Figure 7.
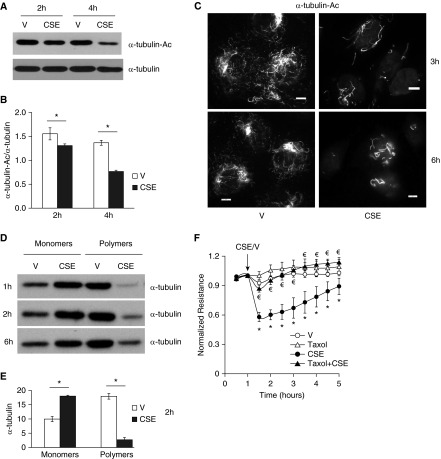
CSE caused lung endothelial barrier dysfunction, α-tubulin deacetylation, and microtubule disassembly. (A–C) Bovine PAECs were treated with vehicle (V; 10% PBS) or 10% CSE for the indicated times. Acetylated α-tubulin (α-tubulin-Ac) was assessed by Western blot (A and B) and immunofluorescence microscopy (C), using anti–acetylated α-tubulin antibody. α-Tubulin was also assessed. (D and E) Bovine PAECs were treated with vehicle (V; 10% PBS) or 10% CSE for the indicated times. Microtubule depolymerization was assessed by examining the levels of monomers and polymers of α-tubulin using microtubule extraction assay. (F) Bovine PAECs were pretreated with 5 μM Taxol for 30 minutes and then treated with vehicle (V; 10% PBS) or 10% CSE in the absence or presence of 5 μM taxol for the indicated times, and monolayer permeability was assessed. Arrows indicate the time of addition of treatments. (A, C, and D) Three independent experiments. Densitometry was performed on immunoblots for A and D. The data are presented as the mean ± SE of the ratio of the densitometry of α-tubulin-Ac to total α-tubulin (B), or as the mean ± SE of the densitometry of α-tubulin at 2 hours (E). ANOVA and Tukey-Kramer post hoc test was used to determine statistically significant difference across means among groups. *P < 0.05 versus respective V; for F, the data are presented as the mean ± SE of the normalized electrical resistance at each time point relative to initial resistance; n = 4. ANOVA and Tukey-Kramer post hoc test was used to determine statistically significant difference across means among groups. *P < 0.05 versus V; €P < 0.05 versus CSE. Scale bars, 10 μm.

