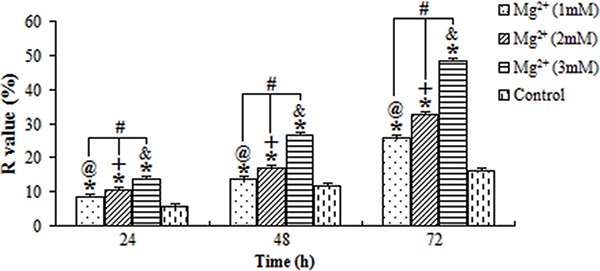
Figure 4. Average fluorescence recovery (R value) for osteoblasts treated with magnesium (Mg2+). The stimulation action was positively associated with the concentration of Mg2+ and the time of exposure. @,+,&P<0.05, for differences over time at concentrations of 1, 2 and 3 mM, respectively. #P<0.05, for differences among various concentrations of Mg2+ at each time point. *P<0.05, for differences from the control group at each time point (ANOVA).