. 2016 Jul 12;5:e14601. doi: 10.7554/eLife.14601

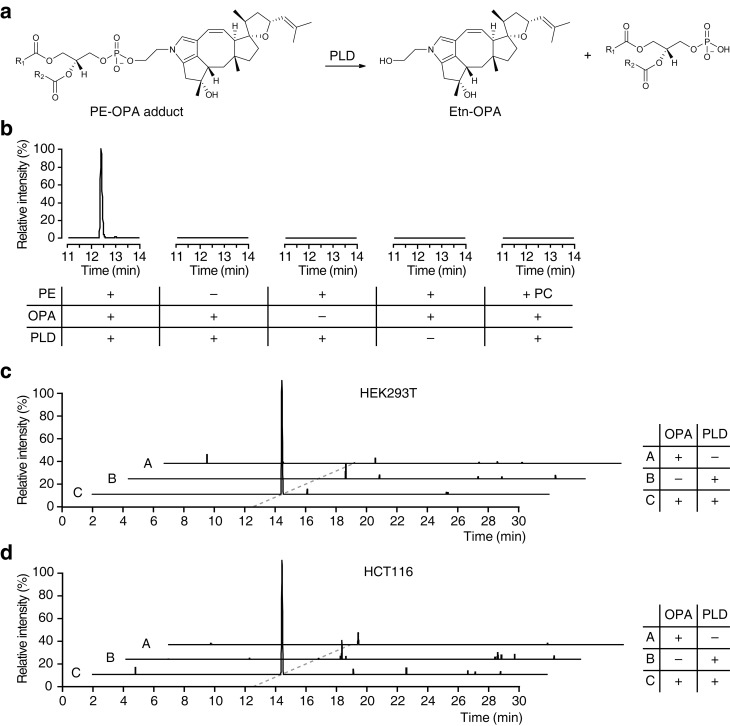
Figure 4. Ophiobolin A (OPA) forms a pyrrole-containing covalent adduct with phosphatidylethanolamine (PE) in human cells.

(a) Formation of PE-OPA adducts was detected by measuring the abundance of ethanolamine-OPA (Etn-OPA) after hydrolysis by phospholipase D from Streptomyces chromofuscus (PLD). (b) Extracted ion chromatograms (m/z = 426.2982–426.3024) of the liquid chromatography-mass spectrometry (LC-MS) analysis of in vitro reactions of PE with OPA and subsequent digestion with PLD. Control reactions include systematic replacement of each reagent by vehicle and replacement of PE with phosphatidylcholine (PC). (c–d) Extracted ion chromatograms (m/z = 426.2982–426.3024) showing the detection of PE-OPA adducts in lipids extracted from cells treated with OPA. (c) HEK293T cells grown in standard conditions were incubated with 250 nM OPA for 24 hr. Total cellular lipids were extracted in the presence of pentyl-pyridoxamine to quench unreacted OPA. Lipids were incubated with PLD and analyzed by LC-MS for the presence of Etn-OPA. Negative controls include replacement of OPA by DMSO vehicle or absence of PLD treatment. (d) Same as (c) but for HCT116 cells treated with 450 nM OPA. Full chromatograms and replicate experiments are available in Figure 4—figure supplement 1.

DOI: http://dx.doi.org/10.7554/eLife.14601.016

Figure 4.

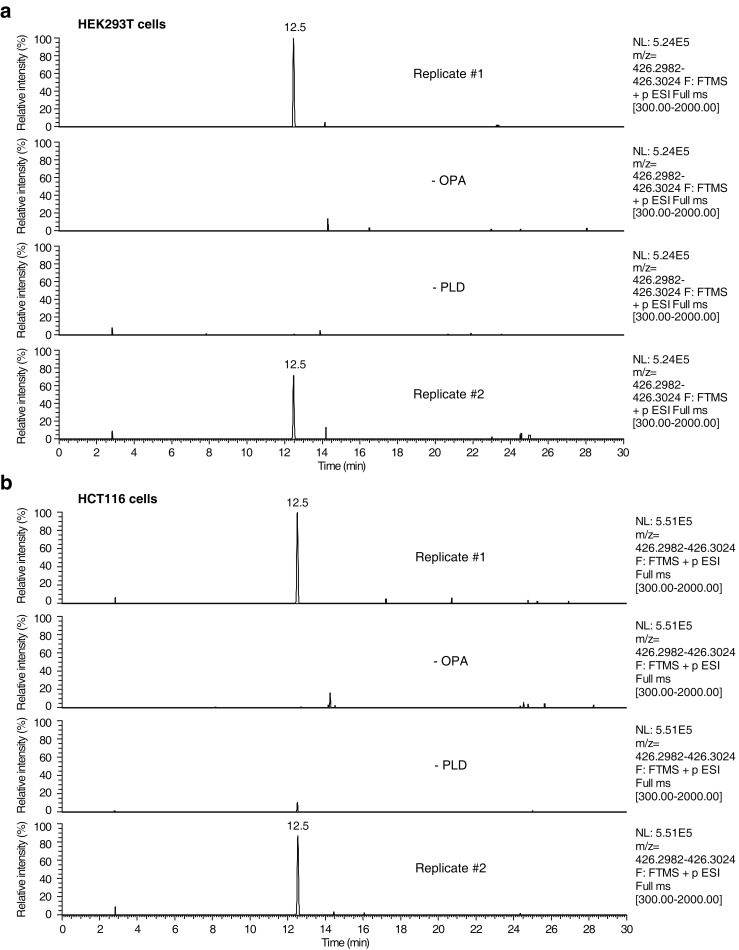
Figure 4—figure supplement 1. Raw data and replicate experiment for data represented in Figure 4c–d.

Figure 4—figure supplement 1.

Extracted ion chromatograms (m/z = 426.2982–426.3024) showing the detection of phosphatidylethanolamine-ophiobolin A (PE-OPA) adducts in lipids extracted from cells treated with OPA. (a) HEK293T cells grown in standard conditions were incubated with 250 nM OPA for 24 hr. Total cellular lipids were extracted in the presence of pentyl-pyridoxamine to quench unreacted OPA and prevent any post-lysis reaction. Lipids were then incubated with phospholipase D (PLD) and analyzed by LC-MS for presence of Etn-OPA. Negative controls include replacement of OPA by DMSO vehicle (- OPA) or absence of PLD treatment (- PLD). (b) Same as (a) but for HCT116 cells treated with 450 nM OPA. Extracted ion intensity levels ('NL') were normalized to the peak of highest intensity.
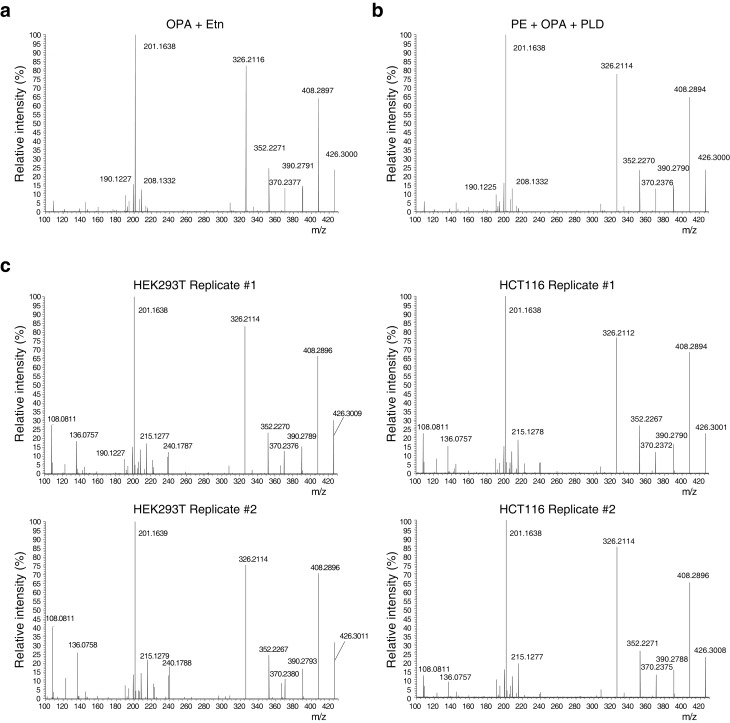
Figure 4—figure supplement 2. Higher-energy collisional dissociation (HCD) MS/MS fragmentation spectra of ethanolamine-ophiobolin A (Etn-OPA).

Figure 4—figure supplement 2.

(a–c) Etn-OPA was unequivocally characterized by its exact mass, liquid chromatography retention time, and MS/MS fragmentation pattern. Ions at m/z = 426.30 and at a retention time of 12.5 min were fragmented by collision-induced dissociation to ensure an MS/MS spectrum consistent with that of Etn-OPA prepared by incubation of OPA with ethanolamine. [M+H]+ ions were targeted using dynamic exclusion at a normalized collision energy of 35 eV. (a) HCD spectrum of ion at m/z = 426.30 and at a retention time of 12.5 min in the experiment in Figure 3d involving in vitro reaction of OPA with ethanolamine. (b) HCD spectrum of ion at m/z = 426.30 and at a retention time of 12.5 min in the experiment in Figure 4b involving in vitro reaction of OPA with phosphatidylethanolamine (PE) and hydrolysis with phospholipase D (PLD). (c) HCD spectrum of ions at m/z = 426.30 and at a retention time of 12.5 min in the experiments in Figure 4c–d and Figure 4—figure supplement 1 involving PLD hydrolysis of phospholipids extracted from cells treated with OPA.