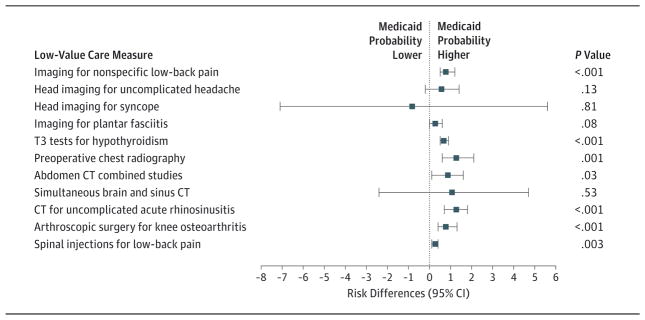
Figure 2. Low-Value Care Risk Differences Associated With the Average Medicaid Patient Moving to a Primary Care Service Area (PCSA) With a 1%Higher Commercial Low-Value Care Rate.
Risk differences were calculated from logistic regression models, as the change in predicted probability of receiving low-value care for the average qualifying Medicaid patient, when the commercial rate of low-value care in their PCSA of residence increases by 1%. Models were adjusted for patient age, sex, rural or urban residence, and Charlson comorbidity index. Dots indicate calculated risk differences; error bars, 95%CIs. The P values test for a significant difference between residing in one PCSA compared with another PCSA with 1% higher commercial low-value care rates.

