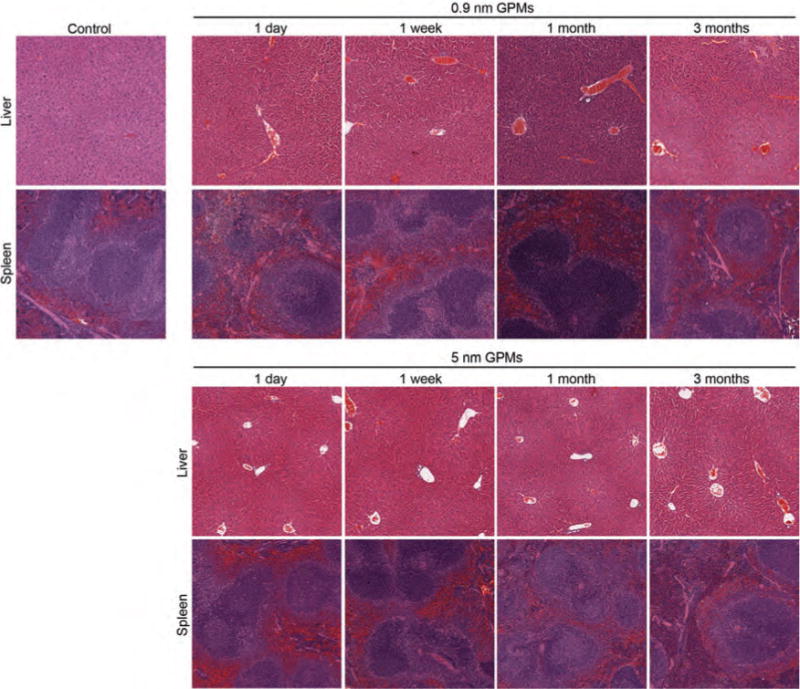
Figure 10.

Histological of liver and spleen for mice treated with GPMs. Mice (n = 3 per group) received a single intravenous injection of 0.2 mL of either PBS (control), 0.9 nm GPMs, or 5 nm GPMs (150 mg Au/kg dose in PBS) followed by dissection of the liver and spleen at the indicated times. Sections were stained with H&E and images were acquired via light microscopy at 10× magnification.
