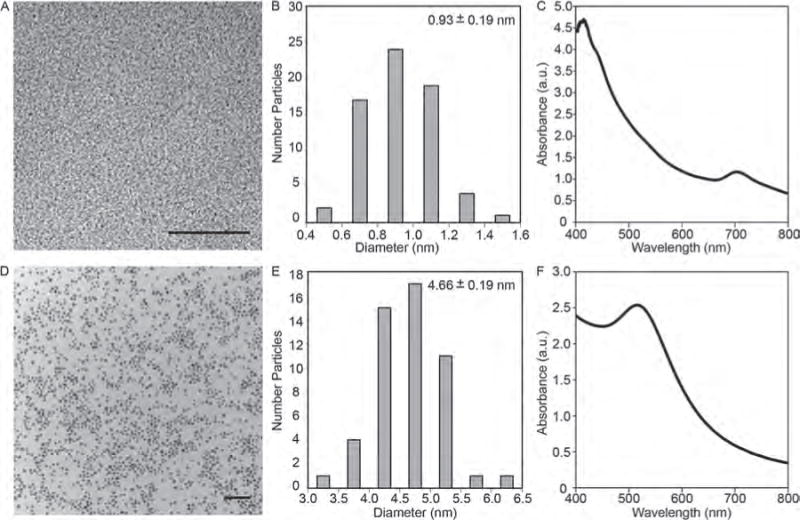
Figure 2.

(A) Transmission electron micrograph of 0.9 nm AuNPs. Scale bar = 20 nm. (B) Core size distribution of 0.9 nm AuNPs. The mean size and standard deviation is shown. (C) UV-vis absorption spectrum of 0.9 nm AuNPs. (D) Transmission electron micrograph of 5 nm AuNPs. Scale bar = 50 nm. (E) Core size distribution of 5 nm AuNPs. The mean size and standard deviation is shown. (F) UV-vis absorption spectrum of 5 nm AuNPs.
