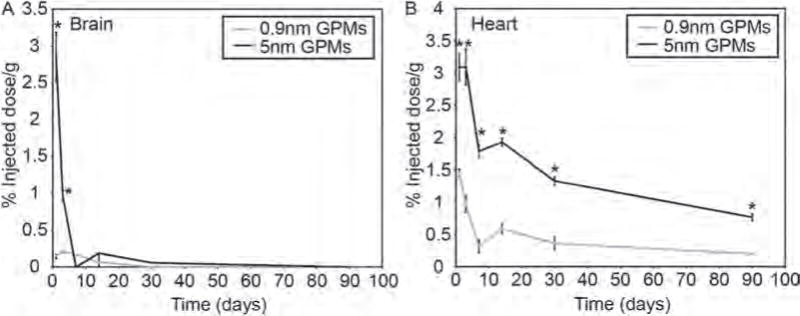
Figure 5.

Measurement of gold content in the brain and heart. The percent injected dose of gold per gram of tissue was measured in the (A) brain and (B) heart at various times following the intravenous administration of 0.9 nm and 5 nm GPMs. All measurements of gold were acquired via ICP-OES. Asterisk indicates statistical significance (p < 0.05) between 0.9 nm GPM and 5 nm GPM groups.
