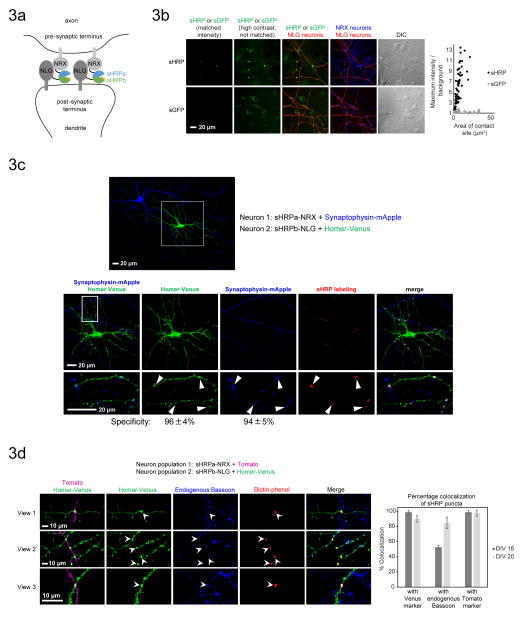
Figure 3. Synapse detection in cultured neurons using sHRP.
A. Scheme for reconstitution of sHRP by the trans-synaptic NRX-NLG interaction in the neuronal synaptic cleft. sHRP constructs are expressed under the synapsin promoter to minimize overexpression artifacts.
B. Comparison of sHRP and split GFP2,7,6 for synapse detection. Constructs with synapsin promoter were introduced into separate neuron populations using a two-step transfection procedure. Confocal images are shown at left, and quantitation of maximum signal/noise as a function of contact site area is shown at right. Plots present >70 contact sites across >5 fields of view for each condition. The sHRP-NRX neurons and the sGFP-NLG neurons were marked by a Tomato co-transfection marker, and the sHRP-NLG neurons were marked by a Venus co-transfection marker. sGFP-NRX neurons were detected by anti-V5 staining (AlexaFluor 647 readout). Intensity scales are not normalized for the transfection markers.
C. sHRP labeling is localized to synapses. Confocal fluorescence imaging of sHRP (synapsin promoter) with respect to pre- and post-synaptic markers, synaptophysin-mApple and Homer-Venus, respectively. Arrowheads point to sHRP labeling sites. Specificity is calculated as the fraction of sHRP puncta that overlap with each marker. Values are the mean +/− std dev of 3 independent experiments.
D. Confocal fluorescence imaging of sHRP (synapsin promoter) with respect to endogenous Bassoon, a pre-synaptic marker. The graph presents the % overlap of sHRP puncta. Data in bar graph represent the mean +/− std dev of 3 independent experiments. Experiments were performed at either 16 days in vitro (DIV) or 20 days in vitro.

