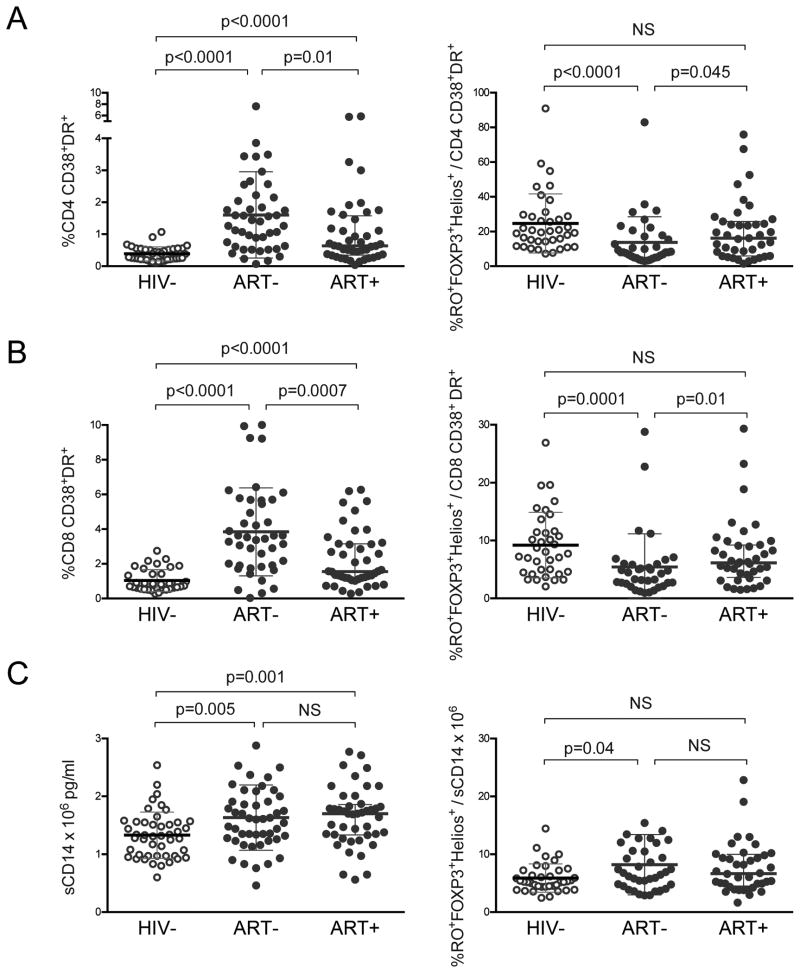
Figure 3. Disrupted balance between Tregs and inflammatory markers in untreated HIV infected children.
Comparison of the following immune activation markers in HIV-, ART-, and ART+ children: (A) %CD38+HLA-DR+ in CD4 T cells, (B) %CD38+HLA-DR+ in CD8 T cells, and (C) sCD14 plasma levels. Graphs on the right show the ratio of %FOXP3+Helios+ in CD45RO+ CD4 T cells to each marker. Comparison graphs depict medians with interquartile ranges; p-values reported for two-sided Mann-Whitney test.

