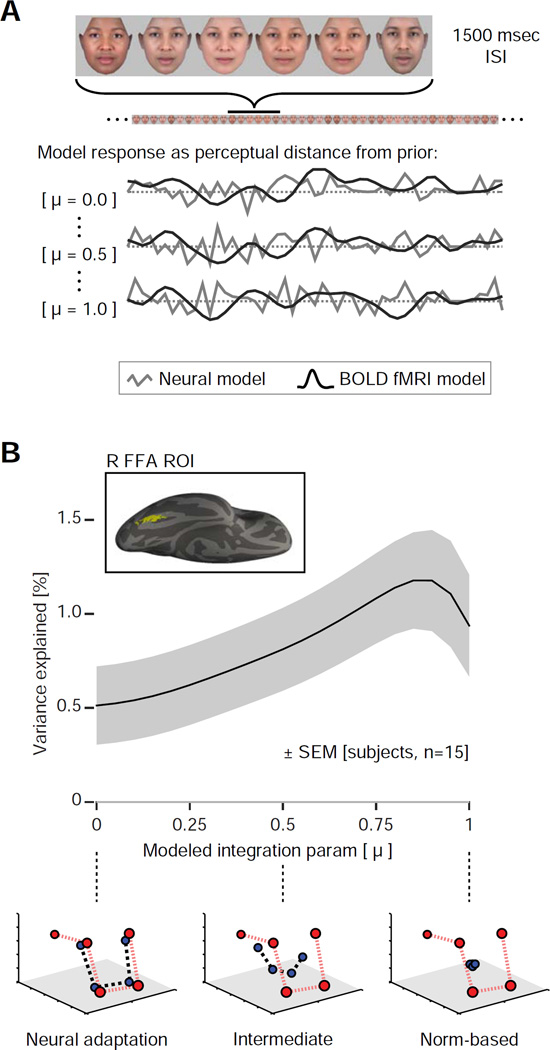
Figure 2.
Experimental design and ROI analysis. (A) During scanning, subjects observed a continuous stream of face stimuli while performing an unrelated attention task. Neural responses were modeled using continuous covariates that tracked the distance between the current stimulus and the calculated “prior” on every trial. A set of 21 models with different values of the temporal integration parameter (μ) were evaluated. (B) Average across-subject (n = 15) fit to the neural data for the range of models, within an across-subject, face-responsive region of interest (ROI) in the right fusiform gyrus (inset). The shaded region represents SEM calculated by bootstrap resampling across subjects. The peak corresponds to a model with an intermediate temporal integration parameter (μ = 0.85). The shape of this curve is dictated by the sampling of models on the x-axis, here a linear scale of μ. An alternative scaling based on the half-life of the underlying exponential is presented in Figure S3C. Schematics below the plot demonstrate the behavior of the prior for three representative values of μ. See also Figure S3.

