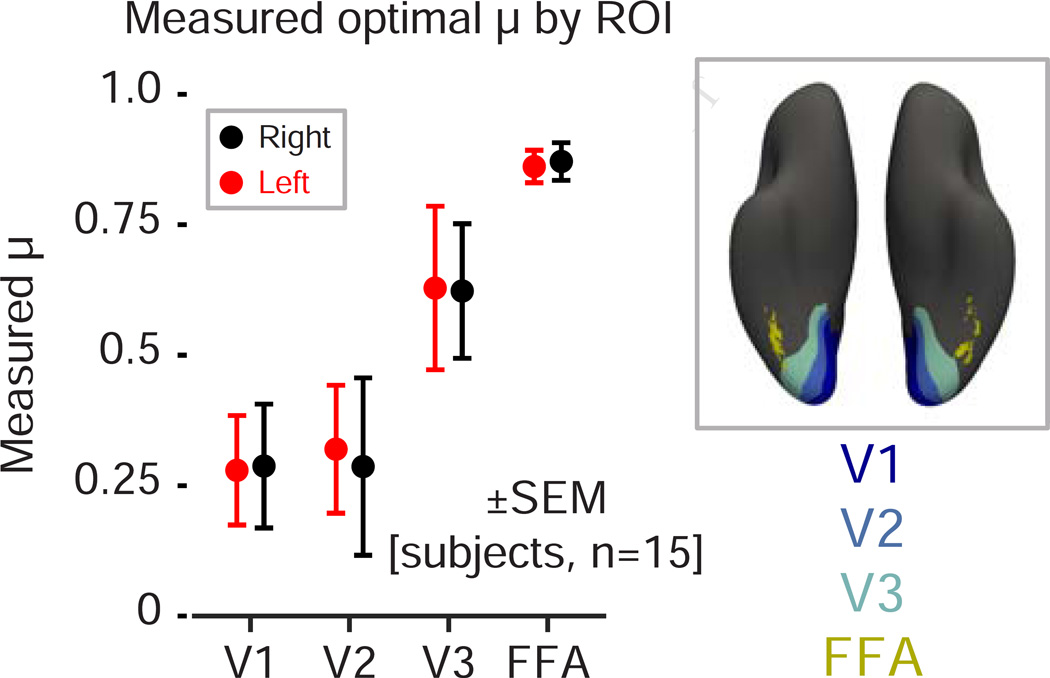
Figure 3.
Temporal integration in the visual hierarchy. Measured temporal integration parameter (μ) across subjects in V1, V2, V3 and FFA. We observed increasingly long temporal integrations along the visual hierarchy, ranging from μ = 0.29 ± 0.12 in area V1, μ = 0.62 ± 0.13 in area V3, and μ = 0.87 ± 0.04 in FFA. Means and standard errors were obtained by bootstrap resampling.

