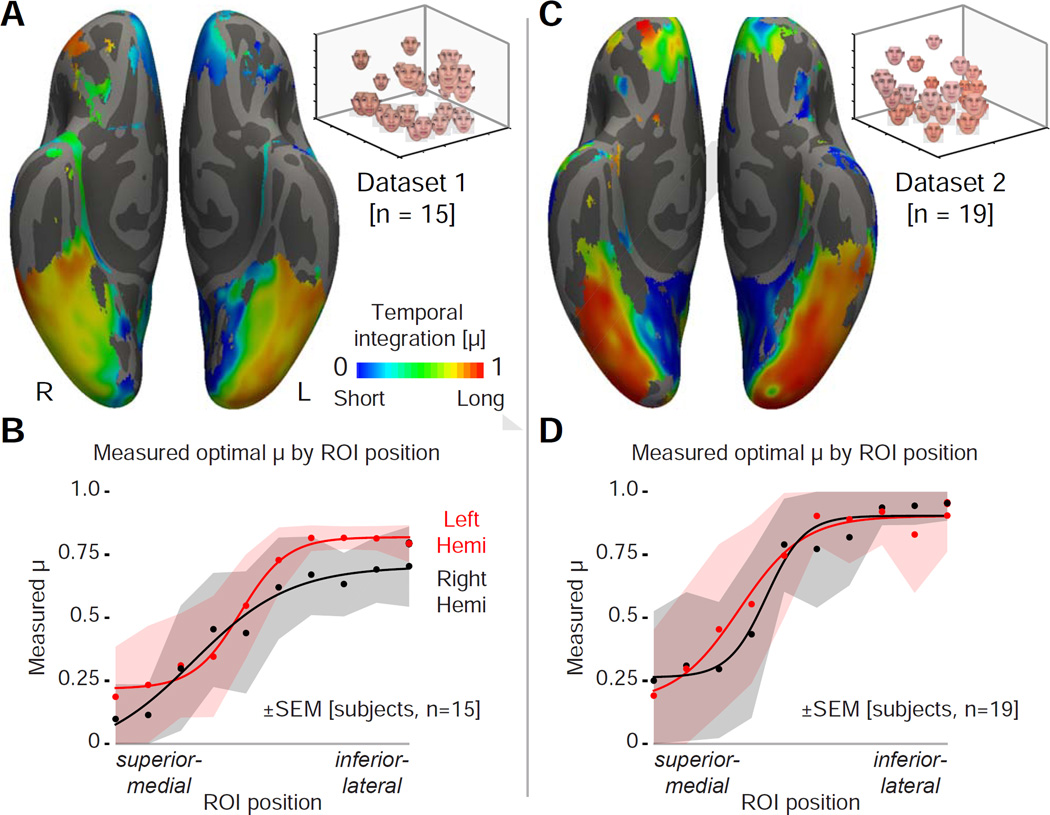
Figure 4.
A gradient of temporal integration. (A) Measured temporal integration parameter (μ) across subjects at each cortical point that showed a modulatory effect of stimulus history (> 0.2% fMRI signal explained). White overlays indicate the points sampled in panel B. (B) Plot of across-subject average, regional μ from the set of sampled points ranging from superior-medial to inferior-lateral. Data points fit with a four-parameter sigmoid function. Means and standard errors were obtained by bootstrap resampling. (C–D) The corresponding measures from a second, independent dataset. See also Figure S4.

