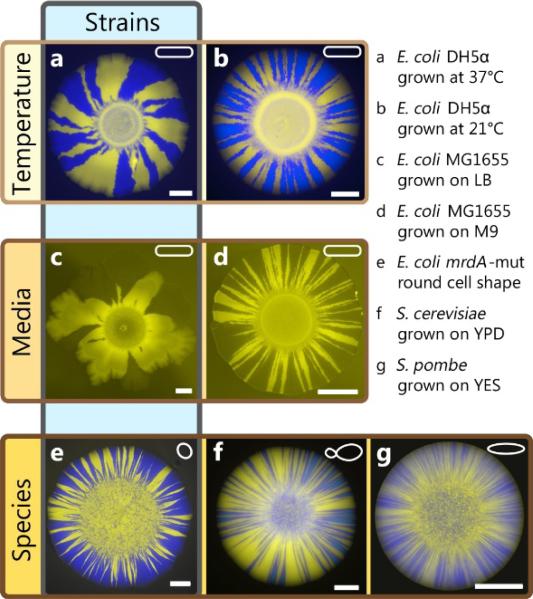
Fig. 5. Variability of genetic drift across species, strains, and environmental conditions.
Each image shows a colony of two neutral strains grown with a starting frequency Pi = 0.5. Colored frames indicate the main differences between images. E. coli colonies (a-e) exhibit fewer sectors and are less regular than yeast colonies (f-g), which produce many sectors. Environmental factors, in particular temperature (a-b) or composition of media (c-d) also influence the strength of genetic drift. Even for identical conditions, different E. coli strains exhibit varying morphologies and sector numbers: For example, mutations influencing cell shape (e) may leads to straighter sectors boundaries and more sectors, although cell shape alone does not accurately predict the strength of genetic drift (compare E. coli (a-d) and S. pombe (g), which are both rod-shaped). All scale bars are 2mm.

