Fig. 2.
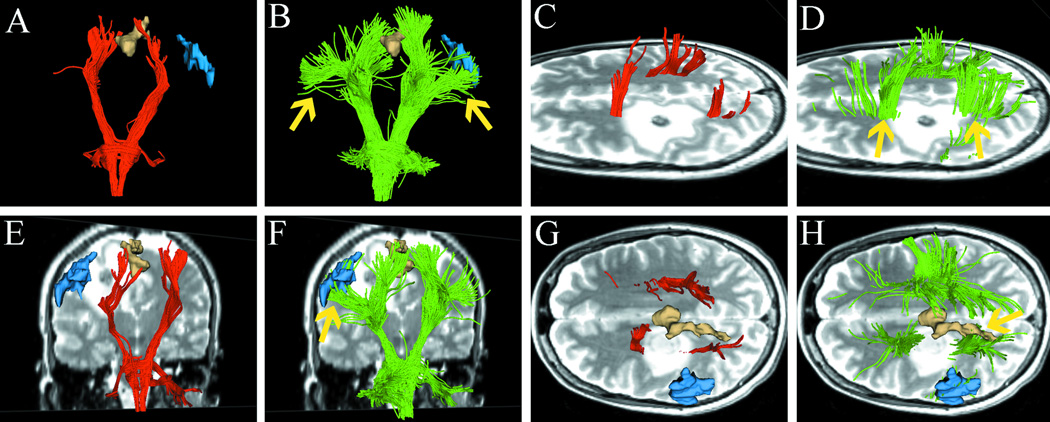
Case 1 tractography results versus fMRI. Images show single-tensor tractography in red, two-tensor UKF tractography in green, and fMRI motor activations of foot (tan) and hand (blue). (A) and (B) show the comparison of tracking results between the methods, where more lateral projections are found by the UKF method (arrows). (C) and (D) show the lateral views of tracking results, where UKF tractography delineates some fiber tracts (arrow) that run through the edema. The correlation between motor fMRI activation and the fiber projections from the two tractography methods is shown in (E–H). Single-tensor streamline does not connect with fMRI activation of hand function (E). In contrast, the lateral projections of CST reconstructed by two-tensor UKF tractography are connected to the activation of hand function (F, arrow). In the superior view, although single-tensor streamline tractography shows some correlation between the medial projections of CST and fMRI activation of foot function (G), the two-tensor UKF tractography demonstrates a better correlation between foot function and fiber tracts (H, arrow).

