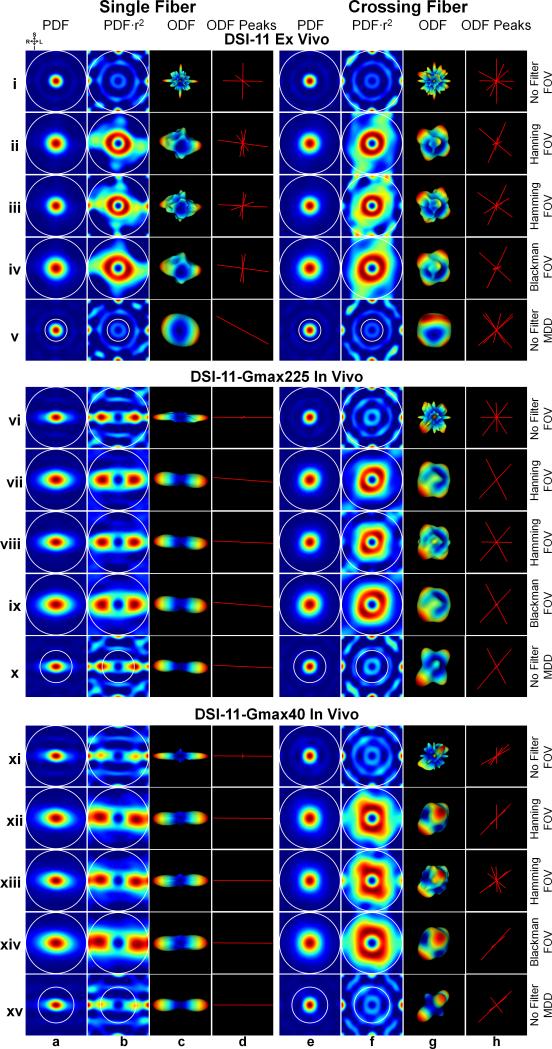
Fig. 3.
Three different ODF reconstruction pipelines for DSI-11 ex vivo (rows i to v), DSI-11-Gmax225 in vivo (rows vi to x) and DSI-11-Gmax40 in vivo data (rows xi to xv). The three pipelines are (1) Unfiltered q-space and integration of the PDF to the full the field-of-view (FOV) (rows i, vi and xi); (2) Filtered q-space and integration of the PDF to the full FOV (rows ii to iv, vii to ix and xii to xiv); (3) Unfiltered q-space and integration of the PDF to the estimated mean displacement distance (MDD) (rows v, x and xv). The single-fiber voxel is from the center corpus callosum. The crossing-fiber voxel is from centrum semiovale (as shown in Fig. 5e, f and g dashed white boxes). Coronal cross-sections through the center of the 3D spin-displacement PDFs are shown in columns a and e. These same PDFs weighted by the square of the displacement distance are shown in columns b and f. The ODFs that correspond to the PDFs in columns b and f are shown in columns c and g. The local maximas (peaks) detected from the ODFs are shown in columns d and h. The white circles represent the integration distance. The color map for both the PDFs and ODFs represents low to high values as blue to red.

