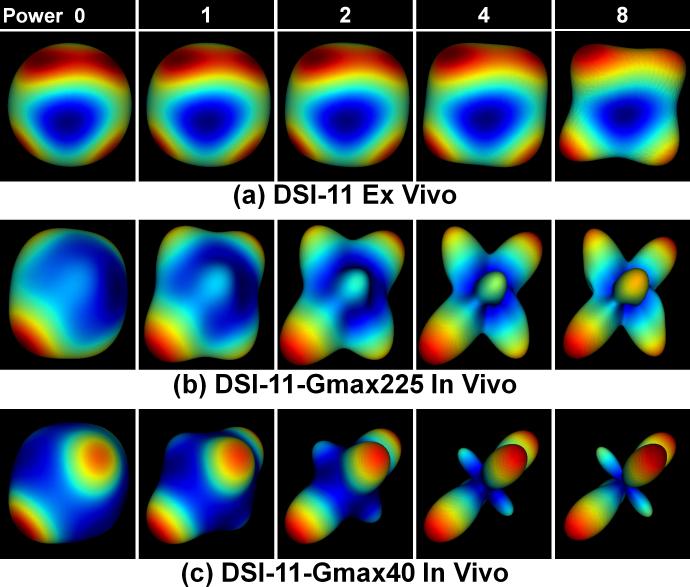
Fig. 4.
An example of the effects of weighting the PDF by different powers, i.e. 0, 1, 2, 4 and 8, of displacement distance on the reconstructed ODF. The crossing-fiber voxel is from centrum semiovale (as shown in Fig. 5e, f and g dashed white boxes). The color map represents low values (blue) to high values (red) in the ODF.

