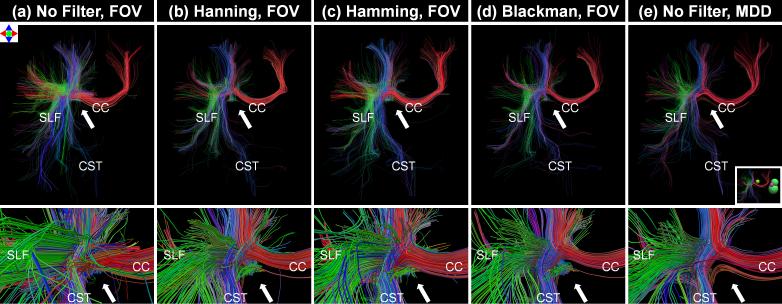
Fig. 6.
Deterministic tractography results shown from an anterior view (top row) and anterior zoomed view (bottom row) for the three ODF processing pipelines from the DSI-11-Gmax40 in vivo data. The three pipelines are (1) Unfiltered q-space and integration of the PDF to the full the field-of-view (FOV) (column a); (2) Filtered q-space and integration of the PDF to the full FOV (columns b to d); (3) Unfiltered q-space and integration of the PDF to the estimated mean displacement distance (MDD) (column e). The tractography results were generated using the centrum semiovale ROIs shown in Fig. 5 as a seed mask. The inset figure shows four spherical exclusion masks placed to eliminate cingulum and contralateral tracts for ease of interpretation. Streamlines are color-coded according to the direction of their middle segment (red: medial-lateral; green: anterior-posterior; blue: superior-inferior).

