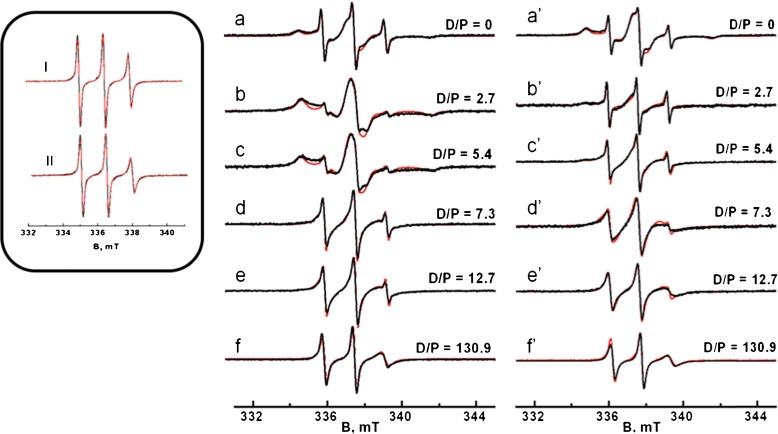
Fig. 2.
Room-temperature EPR spectra of SL1-A β and SL26-A β in PBS for samples with different SDS detergent to peptide (D/P) ratios. a–f Spectra for SL1-A β samples. From a to f, the D/P ratio increases. a’ to f’: Spectra for SL26-A β samples organized as in the left part of the figure. Black line: experiment, red line: simulation. The inset shows the spectra in DMSO where A β is monomeric. I: SL1-A β (rotation-correlation time τ r 0.19 ns), II: SL26-A β (τ r 0.27 ns)

