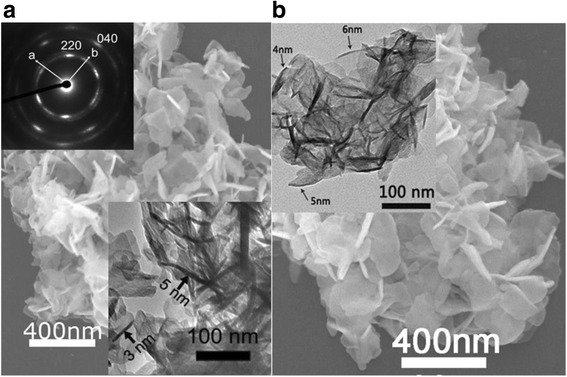
Fig. 2.

SEM and TEM morphology of the products. SEM micrographs showing overall morphologies of the NO3 −-L(Y0.98Eu0.02)H (a) and SO4 2−-L(Y0.98Eu0.02)H (b) samples. The insets are the TEM morphology and selected area electron diffraction (SAED) pattern of the nanosheets
