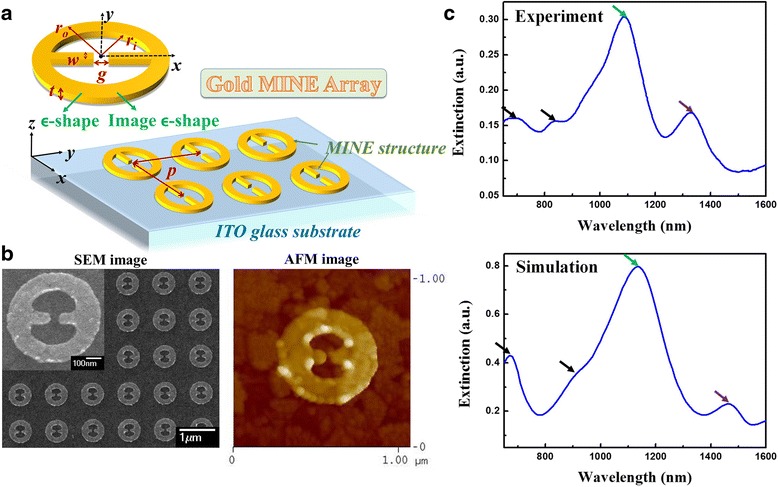
Fig. 1.

a Scheme of the MINE array design. b SEM and AFM images of the fabricated gold MINE array with t = 31 nm, g = 51 nm, w = 77 nm, r i = 174 nm, r o = 304 nm, and p = 1000 nm. The inset shows a magnified SEM image of a single gold MINE structure. c Extinction spectra of the MINE structure from the experiment and simulation
