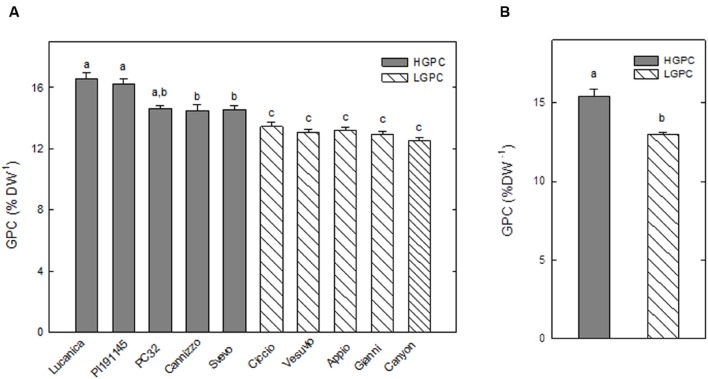
FIGURE 1.
Grain protein content (GPC) of 10 Triticum durum genotypes. (A) GPC in 10 wheat genotypes cultivated for 5 years (2009–2013). Values are the mean ± SE of the medium value obtained in each year; different letters indicate significant differences (one-way ANOVA test; P < 0.05). (B) Average values of GPC for the HGPC and LGPC subgroups; Data are the means ± SE of the GPC of the cultivars belonging to HGPC and LGPC subgroups; different letters indicate values significantly different from one another (one-way ANOVA; P < 0.05).

