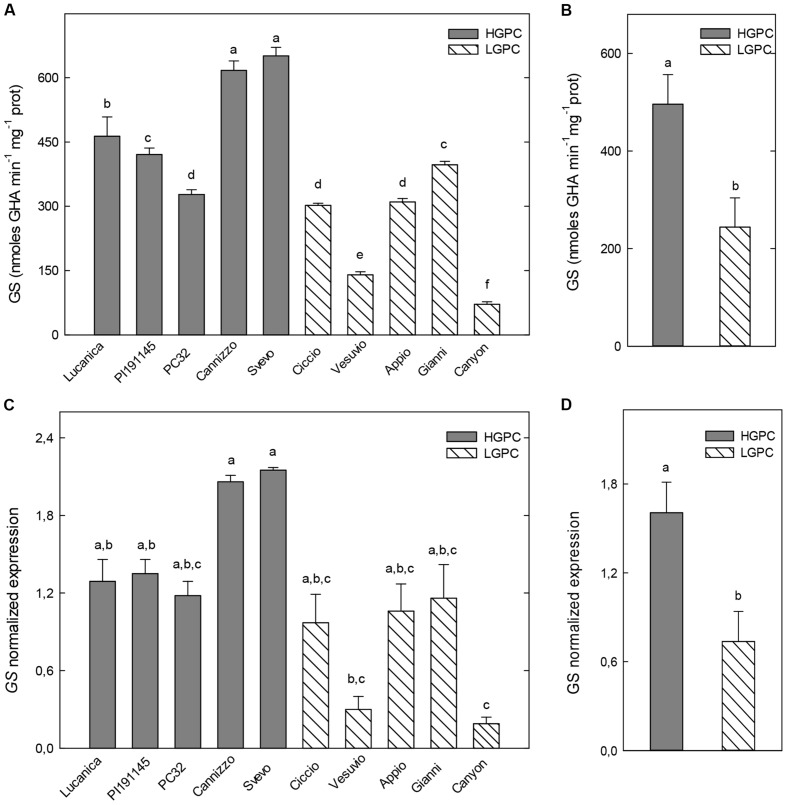
FIGURE 2.
Glutamine synthetase (GS) activity and expression in roots of 10 durum wheat genotypes differing in GPC. (A) GS activity in 10 wheat genotypes. The mean (±SE; n = 5) is presented with different letters representing significant differences (one-way ANOVA test; P < 0.05). (B) GS activity in HGPC and LGPC subgroups; Data are the means ± SE of the GS activity of the cultivars belonging to HGPC and LGPC subgroups; different letters indicate significant differences (one-way ANOVA test; P < 0.05). (C) GS normalized fold expression in 10 wheat genotypes The mean (±SE; n = 5) is presented with different letters representing significant differences (P < 0.05). (D) GS expression in HGPC and LGPC subgroups; Data are the means ± SE of the GS activity of the cultivars belonging to HGPC and LGPC subgroups; different letters indicate significant differences (one-way ANOVA test; P < 0.05).

