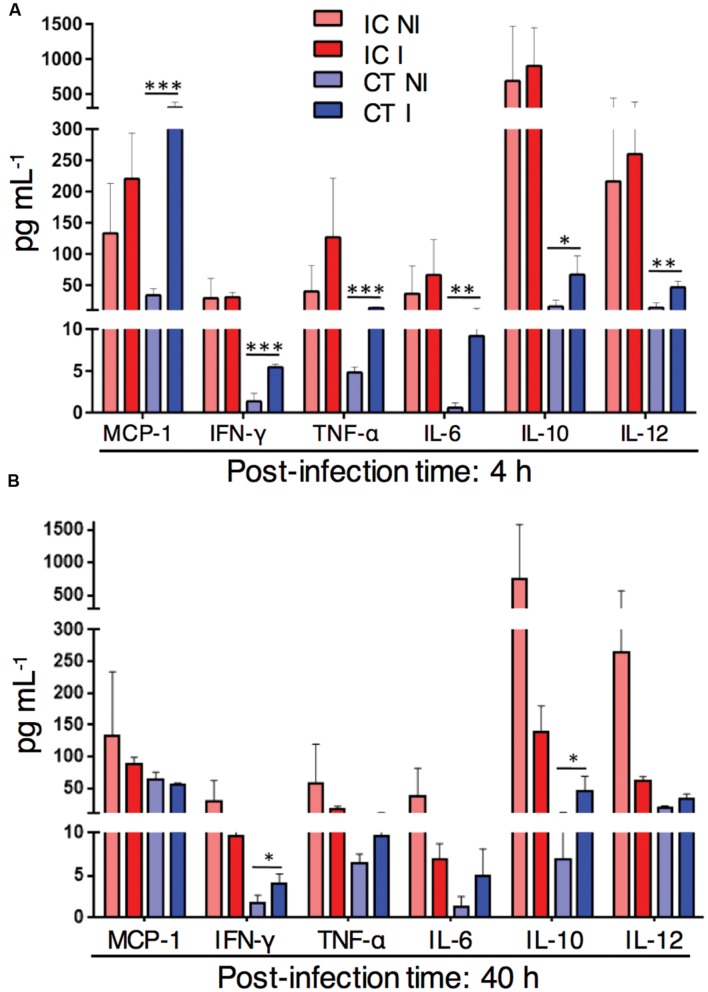
FIGURE 4.
Inflammatory cytokine response in corticosteroid treated (CT) mice after challenge with A. fumigatus conidia. Cytometric Bead Array of lung homogenates from non-infected (NI) or with 1 × 10⁶ A. fumigatus conidia infected (I) immunocompetent (IC) and CT mice. (A) In vivo lung cytokine environment at 4 h after A. fumigatus infection. (B) In vivo lung cytokine environment at 40 h p.i. Data are representative of two independent experiments with n = 3 mice/group in each experiment. Unpaired Mann–Whitney u-test was utilized to determine significant differences: ∗P < 0.05; ∗∗P < 0.01; ∗∗∗P < 0.001.

