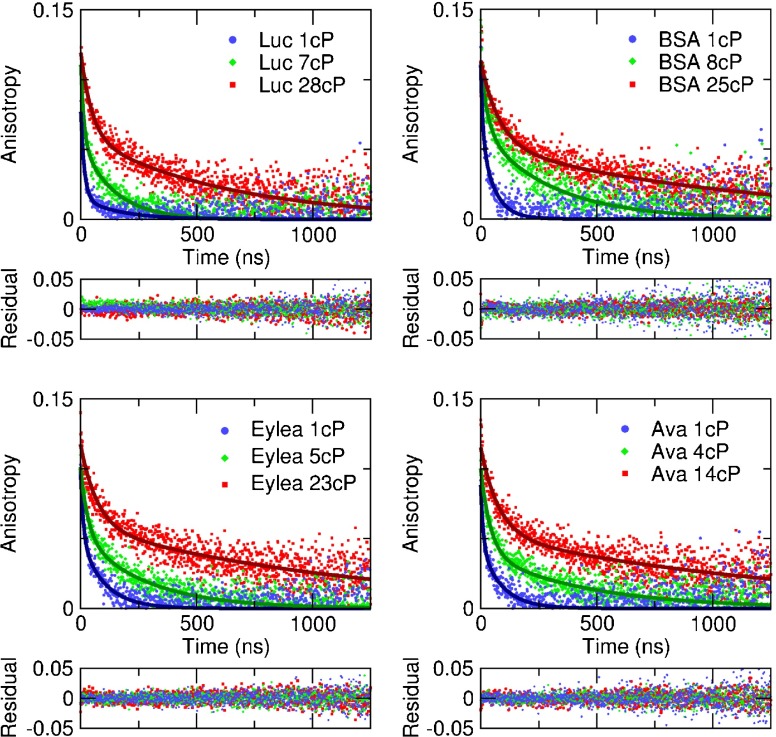
Fig. 3.
Example fits (lines) to measured anisotropy decays (data points) at different viscosities. The rotational correlation time increases with viscosity, and with the drug size. The decays were fitted with a double exponential function (Eq. 7). The residuals are flat without systematic deviations, indicating a good fit.

