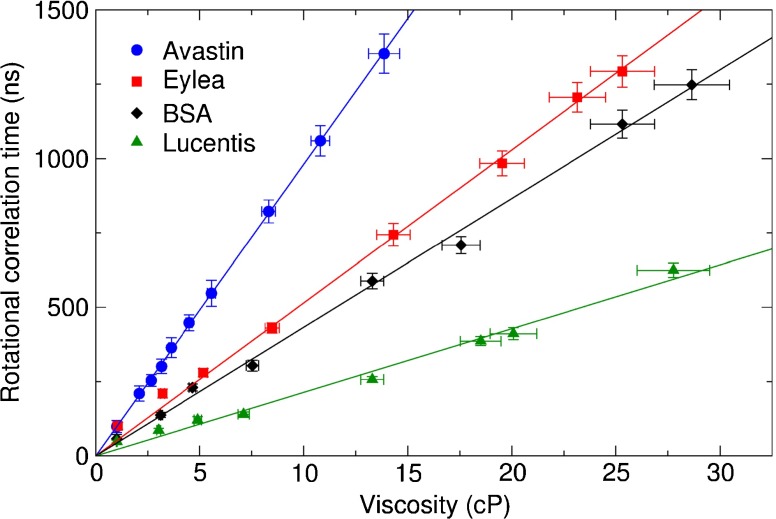
Fig. 4.
A plot of viscosity against rotational correlation time ϕ 2 yields a straight line passing through the origin for all data sets, as expected from Eq. 6. The radius of the molecule can be calculated from the gradient with Eq. 8. The error in the x-axis was derived from the uncertainty in the measured refractive index, and the y-axis error from the uncertainty of the fit to the anisotropy using standard error propagation.

