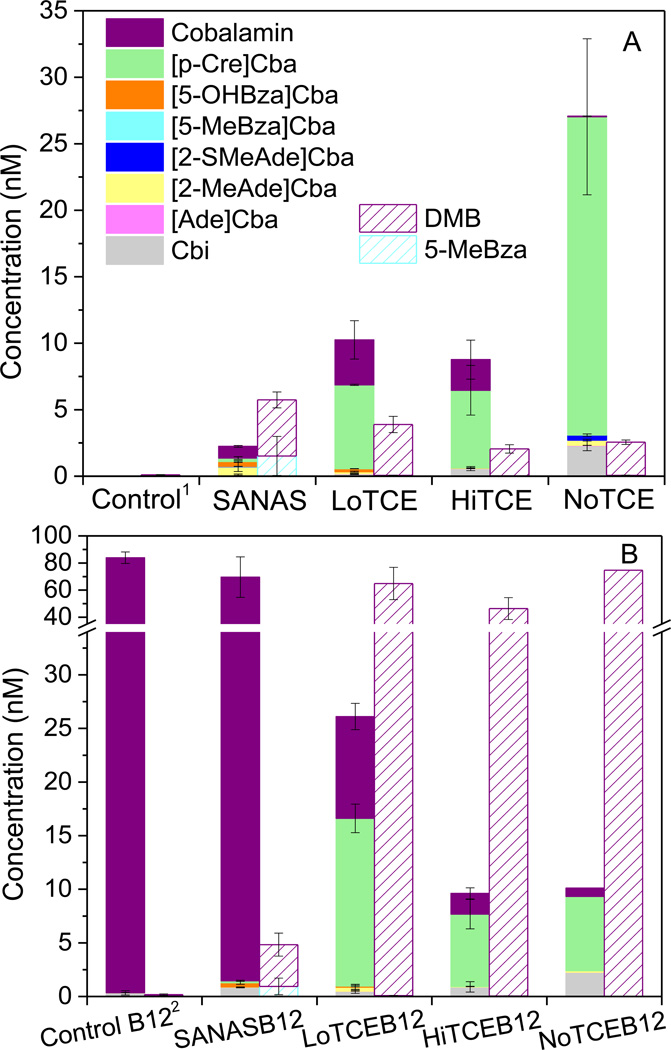
Figure 2.
Corrinoid and benzimidazole lower ligand concentrations in B12-unamended (A) and B12-amended (B) enrichments at the end of 13–18 days’ subculturing cycle, error bars represents standard deviation, n=3 (1Abiotic control without exogenous vitamin B12; 2Abiotic control with 74 nM (c.a.100 µg/L) vitamin B12; Note: (A) and (B) share the same legend, but different y axis scales. Most of the cobalamin in SANASB12 was detected in the supernatant, while most corrinoids were detected in the cell pellets of the other enrichments. Lower ligands were mostly detected in the supernatant).

