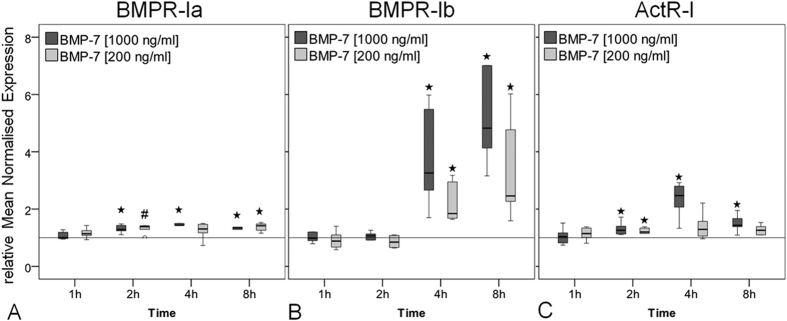
Figure 1. Gene expression of BMP type I receptors in response to BMP-7.
Box plots represent qRT-PCR results given as mean normalised expression relative to 18S rRNA and the untreated control (reference line) using an efficiency corrected formula (n = 6). Symbols indicate statistically significant differences to the untreated control. (A) BMPR-Ia expression was increased after 2 to 8 h of BMP-7 stimulation (#p = 0.015, *p = 0.002). (B) BMPR-Ib expression was highly increased after 4 and 8 h of stimulation compared to unstimulated control (*p = 0.002). (C) ActR-I expression was increased at 2 h to 8 h with a peak at 4 h in the high BMP-7 group (*p = 0.002).

