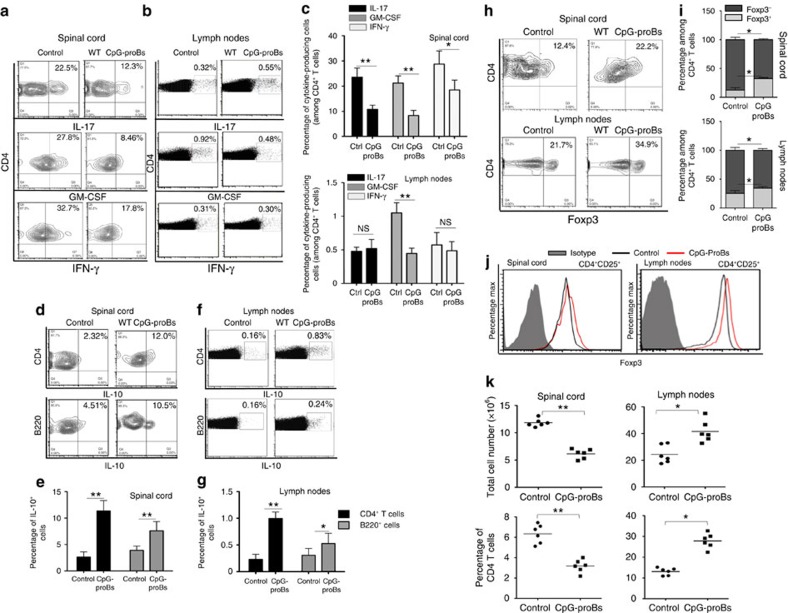
Figure 2. Protective effects of CpG-proBs at the peak of disease.
(a–c) Frequency at day 21 of disease of CD4+ cells producing IL-17, GM-CSF, IFN-γ in spinal cord in a representative experiment (a) and in four experiments (c), and in reactive (cervical, axillary and inguinal) LN (b,c) prepared as described in the ‘Methods' section. (d–g) Production of IL-10 by CD4+ T cells and B220+ B cells from spinal cord (d,e) or reactive LN (f,g) of control or CpG-proB-recipient mice in a representative experiment (d,f) and in three experiments (e,g) in which values are expressed as mean±s.e.m. (h) Frequency within gated CD4+ cells of cells with nuclear expression of the transcription factor Foxp3 in spinal cord and reactive LN. (i,j) Percentages of Foxp3+ and Foxp3− CD4+CD25+ T cells from spinal cord and reactive LN out of four experiments (i), also shown in j from a representative flow cytometry experiment in control mice (black line) and CpG-proB recipients (red line). Cells were stained for Foxp3 (open histograms) versus isotype control (filled histograms). (k) Total cell counts and percentage of CD4+ T cells within spinal cord and reactive LN of control or CpG-proB-recipient mice at the peak of the disease. *P<0.05, **P<0.005, when comparing CpG-proB-injected mice and other groups. n=6 mice per group (Students' t-test).

