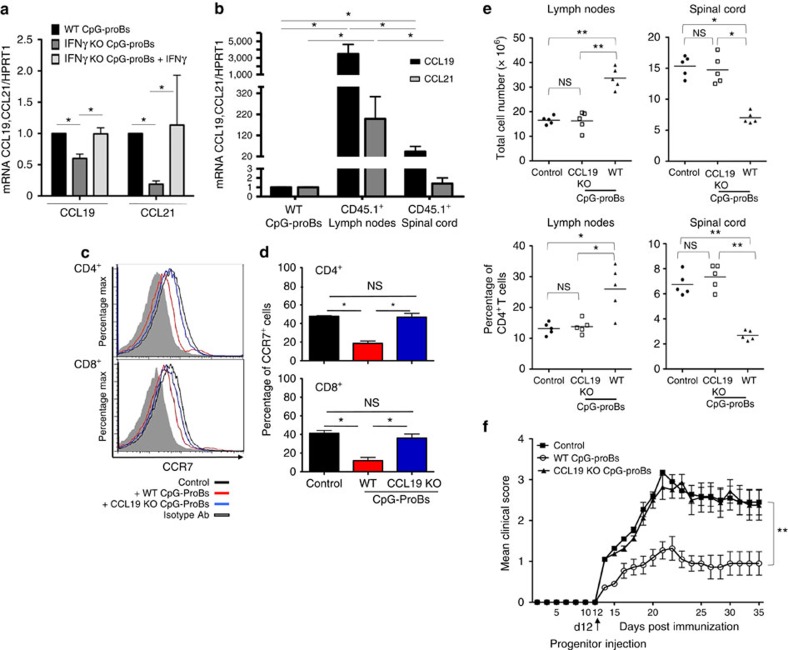
Figure 6. Role of CCL19 in the protective properties of CpG-proBs.
(a) CCL19 and CCL21 mRNA levels relative to HPRT1 in WT or IFN-γ−/− CpG-proB cells isolated from BM cells stimulated with CpG-B or CpG-B+IFN-γ for 18 h followed by PMA+ionomycin for 5 h. Data are expressed as means±s.e.m. of three experiments. *P<0.05 by the non-parametric Mann–Whitney's t-test. (b) CCL19 and CCL21 mRNA levels were assessed as in a in the progeny of WT CD45.1+ CpG-proBs recovered in reactive LN and spinal cord of CD45.2+ recipients 6 days after adoptive transfer of CD45.1+ CpG-proBs, and compared with levels in WT CpG-proBs. Data are expressed as mean±s.e.m. from 3–5 experiments. *P<0.05 (Students't-test). (c,d) CCR7 expression analysis in CD4+ and CD8+ T cells from reactive LN of control mice (black line) and mice transferred with WT-CpG-proBs (red line) or CCL19-KO CpG-proBs (blue line), after staining with a specific anti-CCR7 antibody (open histograms) or with an isotype control (filled histogram) of intact and permeabilized cells. A representative experiment is shown in c and the mean±s.e.m. out of three experiments in d. (e) Control mice or mice injected at day 12 with CpG-proBs derived from WT or CCL19-deficient donors were killed on day 21 of the disease and reactive LN and spinal cord cells counted. Shown are total cell counts and percentage of CD4+ T cells recovered per organ, *P<0.05, **P<0.005 (Students' t-test). (f) EAE clinical scores (mean±s.e.m.) in control mice (n=10) or mice injected either with WT (n=10) or CCL19-deficient CpG-proBs (n=10). ***P<0.001, between controls or CCL19−/− and WT CpG-proB recipients, non significant between controls and CCL19−/− CpG-proB-treated mice, using the two-way repeated measures ANOVA test.

