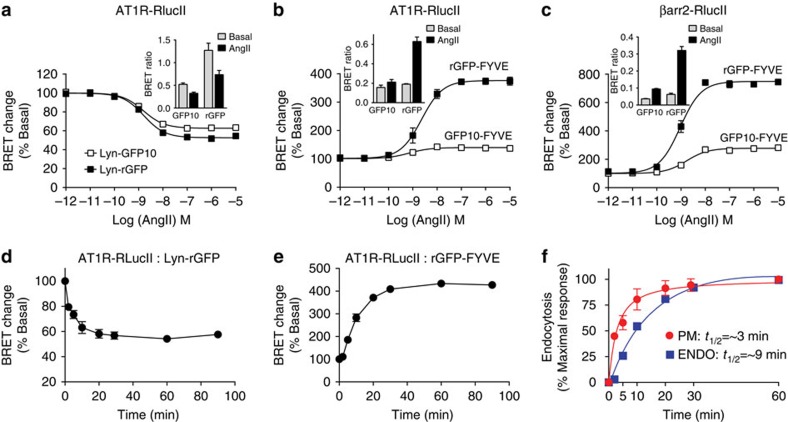
Figure 2. Agonist- and time-dependent trafficking of AT1R and β-arrestin2 measured by EbBRET.
HEK293 cells were transfected with the indicated EbBRET pairs. To monitor AT1R-mediated βarr2-RlucII trafficking, 3 μg of AT1R was co-transfected in addition to the indicated BRET pairs in c. Cells were incubated with the indicated concentrations of AngII for 30 min (a), or 40 min (b,c), and BRET signals were measured as described in the Methods section. The BRET ratio changes on agonist treatment are expressed as a percentage of BRET ratio observed in the control (without AngII) group. (a–c, inset) Raw BRET ratios in the absence (basal) or presence of 100 nM AngII were plotted as bar graphs. Data are represented as the means±s.e.m. of three independent experiments. (d,e) Cells were incubated in the absence or presence of 100 nM AngII at 37 °C for the indicated times before BRET measurements. The BRET ratio changes on agonist treatment are expressed as a percentage of BRET ratio observed in the control (without AngII) group. Data are represented as the means±s.e.m. of three independent experiments. (f) Data in d and e were normalized to their respective maximal responses and plotted in the same graph. The t1/2 for maximal responses were calculated using a single-exponential fit using GraphPad Prism.

